# openharmony-vchart-example
**Repository Path**: VisActor/openharmony-vchart-example
## Basic Information
- **Project Name**: openharmony-vchart-example
- **Description**: vchart openharmony 环境示例
- **Primary Language**: JavaScript
- **License**: Not specified
- **Default Branch**: main
- **Homepage**: None
- **GVP Project**: No
## Statistics
- **Stars**: 0
- **Forks**: 0
- **Created**: 2024-06-11
- **Last Updated**: 2024-06-11
## Categories & Tags
**Categories**: Uncategorized
**Tags**: None
## README
# Harmony VChart
- Github仓库地址:https://github.com/VisActor/openharmony-vchart-example/
- Gitee仓库地址:https://gitee.com/VisActor/openharmony-vchart-example/
OpenHarmony是由开放原子开源基金会(OpenAtom Foundation)孵化及运营的开源项目,目标是面向全场景、全连接、全智能时代,基于开源的方式,搭建一个智能终端设备操作系统的框架和平台,促进万物互联产业的繁荣发展。
VChart 从 1.11.1 版本开始,支持兼容 OpenHarmony 应用开发的图表开发(支持API 10 Release以上),为了方便 OpenHarmony 技术栈的同学更好的使用,我们提供了 VChart 的 OpenHarmony 封装包`@visactor/harmony-vchart`(此包不是 NPM 包,是 OHPM 包),该组件的 spec 配置项与 VChart 一致
我们将在本教程中详细讲解如在 OpenHarmony 项目中使用 VChart,并创建一个简单的柱状图。
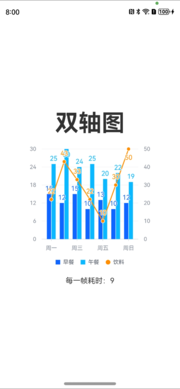
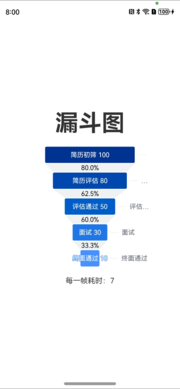
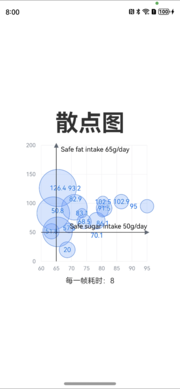
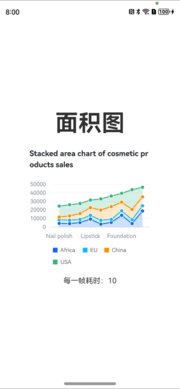
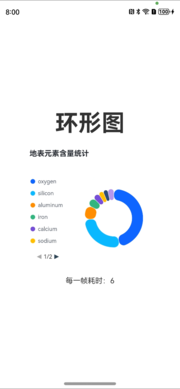
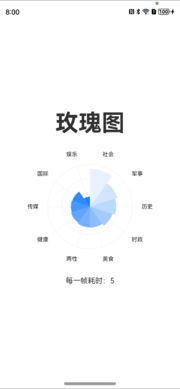
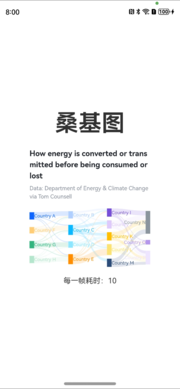
## 效果展示
## 快速上手
本文假设用户已了解 OpenHarmony 应用开发流程,具体 OpenHarmony 的相关知识,请参考[OpenHarmony应用开发快速入门](https://gitee.com/openharmony/docs/blob/master/zh-cn/application-dev/quick-start/start-overview.md)
### 如何安装
要开始使用 Harmony VChart,首先需要在你的 Harmony 项目中安装 `@visactor/harmony-vchart` 包。在项目根目录下,使用以下命令安装该包:
```
ohpm install @visactor/harmony-vchart
```
### 创建图表
以创建一个简单的状图为例。在你的 Harmony 组件中,引入 `visactor/harmony-vchart` 的 `` 组件,并在组件中使用它们。下面是一个创建柱状图的示例代码:
```typescript
import { VChart } from '@visactor/harmony-vchart';
const spec = '{"type":"bar","data":[{"id":"barData","values":[{"type":"Autocracies","year":"1930","value":129},{"type":"Autocracies","year":"1940","value":133},{"type":"Autocracies","year":"1950","value":130},{"type":"Autocracies","year":"1960","value":126},{"type":"Autocracies","year":"1970","value":117},{"type":"Autocracies","year":"1980","value":114},{"type":"Autocracies","year":"1990","value":111},{"type":"Autocracies","year":"2000","value":89},{"type":"Autocracies","year":"2010","value":80},{"type":"Autocracies","year":"2018","value":80},{"type":"Democracies","year":"1930","value":22},{"type":"Democracies","year":"1940","value":13},{"type":"Democracies","year":"1950","value":25},{"type":"Democracies","year":"1960","value":29},{"type":"Democracies","year":"1970","value":38},{"type":"Democracies","year":"1980","value":41},{"type":"Democracies","year":"1990","value":57},{"type":"Democracies","year":"2000","value":87},{"type":"Democracies","year":"2010","value":98},{"type":"Democracies","year":"2018","value":99}]}],"seriesField":"type","xField":["year","type"],"yField":"value","bar":{"style":{"stroke":"#000","lineWidth":1},"state":{"hover":{"stroke":"black"}}},"legends":{"visible":true,"position":"start","orient":"top"}}'
@Entry
@Component
struct Index {
@State message: string = 'Hello World';
build() {
Row() {
Column() {
Text(this.message)
.fontSize(50)
.fontWeight(FontWeight.Bold)
VChart({
spec: JSON.parse(spec), w: 300, h: 300,
onChartInitCb: () => {},
onChartReadyCb: () => {}
})
}
.width('100%')
}
.height('100%')
}
}
```
在这个示例中,我们创建了一个简单的柱状图,使用了一些基本的组件和配置。
## 统一图表标签 ``
`` 接收的一个完整的**spec**作为图表定义,其**spec**的数据结构完全等同于 VChart 中的定义,因此开发者可以将任何对于 VChart 合法的 spec 送入 Harmony-VChart 中进行图表渲染。
### Props
如果你已经有了 spec 图表描述信息,使用统一图表标签是比较快捷的方式,只需要引入`VChart`组件即可:
```typescript
import { VChart } from '@visactor/harmony-vchart';
```
`VChart`组件即封装的 Harmony 组件,其 props 定义如下:
```typescript
interface VChartProps extends EventsProps {
/** 图表定义 */
spec: any;
/** 图表配置 */
options?: IInitOption;
/**
* 图表初始化的回调
* @param vchart
*/
onChartInitCb?: (vchart: VChartConstructor) => void;
/**
* 图表准备好的回调(第一次渲染完成)
* @param vchart
*/
onChartReadyCb?: (vchart: VChartConstructor) => void;
/** throw error when chart run into an error */
onError?: (err: Error) => void;
/**
* 切换到同步渲染
*
* @since 1.8.3
**/
useSyncRender?: boolean;
/**
* props更新的时候,跳过所有函数的检查,即所有的函数都认为没有更新
*
* @since 1.6.5
**/
skipFunctionDiff?: boolean;
}
```
```typescript
export interface IInitOption {
/**
* 图表开始渲染的回调
* @param vchart
*/
beforeRender?: (stage: Object) => void;
/**
* 渲染完成的回调
* @param vchart
*/
afterRender?: (stage: Object) => void;
/**
* 启用的插件列表
*/
pluginList?: string[];
/** 数据集 */
dataSet?: Object;
/**
* 是否开启动画
*/
animation?: boolean;
/**
* 当文本省略时,鼠标 hover 到文本上时是否显示 poptip
* @default true
*/
poptip?: boolean;
/**
* 报错的回调函数
* @since 1.2.0
*/
onError?: () => void;
/**
* 默认主题(支持完整主题对象或者主题名称,主题名称需要提前在 `ThemeManager` 中注册)
* @since 1.3.0
*/
theme?: string;
}
```
`EventsProps` 的定义参考事件交互章节
`onChartReadyCb`是一个内置的回调事件,会在图表渲染或更新时触发,其入参分别代表图表实例对象,以及是否初次渲染。
举例来说,开发者可以在初次渲染时,将需要触发的回调事件注册在图表实例上以实现图表交互功能。
## 事件交互
### 基础事件
统一图表标签(VChart)是最外层图表组件,其 Props 上都支持底层渲染层抛出的场景树事件`EventsProps`。
`EventsProps`的定义如下:
```typescript
interface EventsProps {
onPointerDown?: (e: any) => void | boolean;
onPointerUp?: (e: any) => void | boolean;
onPointerUpOutside?: (e: any) => void | boolean;
onPointerTap?: (e: any) => void | boolean;
onPointerOver?: (e: any) => void | boolean;
onPointerMove?: (e: any) => void | boolean;
onPointerEnter?: (e: any) => void | boolean;
onPointerLeave?: (e: any) => void | boolean;
onPointerOut?: (e: any) => void | boolean;
onMouseDown?: (e: any) => void | boolean;
onMouseUp?: (e: any) => void | boolean;
onMouseUpOutside?: (e: any) => void | boolean;
onMouseMove?: (e: any) => void | boolean;
onMouseOver?: (e: any) => void | boolean;
onMouseOut?: (e: any) => void | boolean;
onMouseEnter?: (e: any) => void | boolean;
onMouseLeave?: (e: any) => void | boolean;
onPinch?: (e: any) => void | boolean;
onPinchStart?: (e: any) => void | boolean;
onPinchEnd?: (e: any) => void | boolean;
onPan?: (e: any) => void | boolean;
onPanStart?: (e: any) => void | boolean;
onPanEnd?: (e: any) => void | boolean;
onDrag?: (e: any) => void | boolean;
onDragStart?: (e: any) => void | boolean;
onDragEnter?: (e: any) => void | boolean;
onDragLeave?: (e: any) => void | boolean;
onDragOver?: (e: any) => void | boolean;
onDragEnd?: (e: any) => void | boolean;
onRightDown?: (e: any) => void | boolean;
onRightUp?: (e: any) => void | boolean;
onRightUpOutside?: (e: any) => void | boolean;
onTouchStart?: (e: any) => void | boolean;
onTouchEnd?: (e: any) => void | boolean;
onTouchEndOutside?: (e: any) => void | boolean;
onTouchMove?: (e: any) => void | boolean;
onTouchCancel?: (e: any) => void | boolean;
onPress?: (e: any) => void | boolean;
onPressUp?: (e: any) => void | boolean;
onPressEnd?: (e: any) => void | boolean;
onSwipe?: (e: any) => void | boolean;
onDrop?: (e: any) => void | boolean;
onWeel?: (e: any) => void | boolean;
onClick?: (e: any) => void | boolean;
onDblClick?: (e: any) => void | boolean;
}
```
## 总结
通过本教程,你应该已经学会了如何在 OpenHarmony 项目中使用 VChart 图表创建一个简单的柱状图。同时,你还了解了如何根据需求配置图表,以满足项目中不同的场景。VChart 提供了丰富的配置选项和组件,相信你在实际项目中会更好地掌握它们的使用,并发挥出更大的作用。希望你能在项目中愉快地使用 VChart 表库!
## 🔗 相关链接
- [Homepage](https://www.visactor.io/vchart)
- [VCharts Gallery](https://www.visactor.io/vchart/example)
- [VChart Tutorials](https://www.visactor.io/vchart/guide/tutorial_docs/VChart_Website_Guide)
- [VChart Options](https://www.visactor.io/vchart/option/)
- [VChart API](https://www.visactor.io/vchart/api/API/vchart)
- [VGrammar](https://www.visactor.io/vgrammar)
- [VRender](https://www.visactor.io/vrender)
- [FAQ](https://www.visactor.io/vchart/guide/tutorial_docs/FAQ)
- [CodeSandbox Template](https://codesandbox.io/s/the-template-of-visactor-vchart-vl84ww?file=/src/index.ts) for bug reports