# aliyun-log-grafana-datasource-plugin
**Repository Path**: aliyun/aliyun-log-grafana-datasource-plugin
## Basic Information
- **Project Name**: aliyun-log-grafana-datasource-plugin
- **Description**: 阿里云日志服务Grafana数据源插件 Aliyun Log Service grafana datasource plugin
- **Primary Language**: Unknown
- **License**: MIT
- **Default Branch**: master
- **Homepage**: None
- **GVP Project**: No
## Statistics
- **Stars**: 0
- **Forks**: 0
- **Created**: 2025-05-08
- **Last Updated**: 2025-05-10
## Categories & Tags
**Categories**: Uncategorized
**Tags**: None
## README

   
**简体中文** | [English](https://github.com/aliyun/aliyun-log-grafana-datasource-plugin/blob/master/README_EN.md) | [旧版README](https://github.com/aliyun/aliyun-log-grafana-datasource-plugin/blob/master/old_README_CN.md) | [Old Version README](https://github.com/aliyun/aliyun-log-grafana-datasource-plugin/blob/master/old_README.md)
# 1. 简介
日志服务 SLS 是云原生观测分析平台,为Log/Metric/Trace等数据提供大规模、低成本、实时平台化服务。一站式提供数据采集、加工、分析、告警可视化与投递功能,全面提升研发、运维、运营和安全等场景数字化能力。[官方文档](https://www.aliyun.com/product/sls)
本仓库为阿里云日志服务Grafana数据源插件。使用本插件的前提,需要您使用日志服务产品,并拥有至少1个已配置采集的LogStore。
# 2. 安装
依赖 Grafana 8.0 及以上版本 , Grafana 8.0 以下请使用1.0版本。
于[Release处下载](https://github.com/aliyun/aliyun-log-grafana-datasource-plugin/releases)本插件到grafana插件目录下,修改配置文件,在配置文件的[plugins] 节点中,设置 `allow_loading_unsigned_plugins = aliyun-log-service-datasource`, 然后重启grafana。
- mac
- 插件目录: `/usr/local/var/lib/grafana/plugins`
- 配置文件位置:`/usr/local/etc/grafana/grafana.ini`
- 重启命令:`brew services restart grafana`
- YUM/RPM
- 插件目录:`/var/lib/grafana/plugins`
- 配置文件位置:`/etc/grafana/grafana.ini`
- 重启命令:`systemctl restart grafana-server`
- .tar.gz
- 插件目录:`{PATH_TO}/grafana-{x}.{x}.{x}/data/plugins`
- 配置文件位置:`{PATH_TO}/grafana-{x}.{x}.{x}/conf/defaults.ini`
- 重启命令:`./bin/grafana-server web`
# 3. 添加数据源
## 3.1 日志库配置
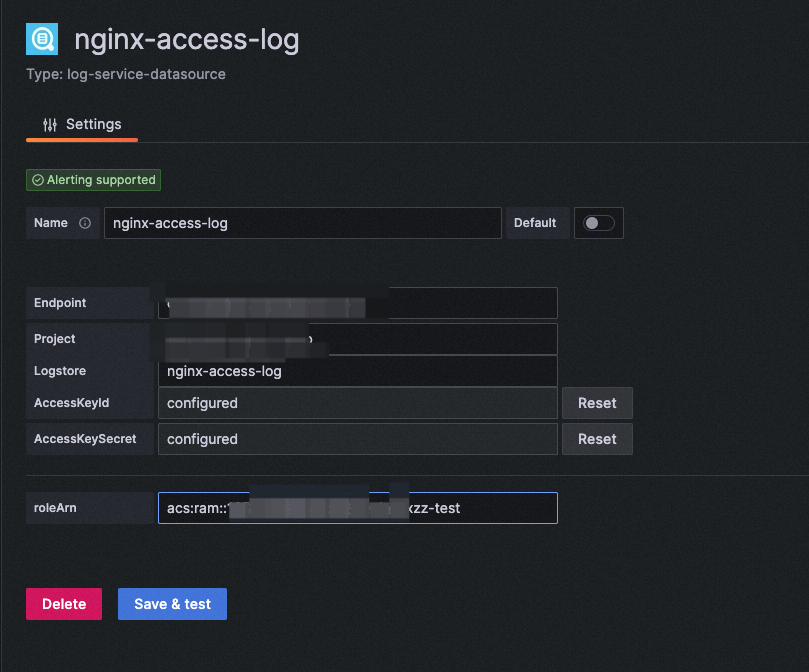
在datasource界面添加一个SLS log-service-datasource数据源。在数据源管理面板, 添加 LogService 数据源,在 settings 面板, 设置 Endpoint 为您日志服务 project 的 endpoint ( endpoint 在 project 的概览页可以看到,详情请参见[服务入口](https://help.aliyun.com/document_detail/29008.htm#reference-wgx-pwq-zdb))。例如您的 project 在 qingdao region, Url 可以填 `cn-qingdao.log.aliyuncs.com`。根据需要设置 Project 和 logstore,设置 AccessId 和 AccessKeySecret , 最好配置为子账号的AK。为保证数据安全 , AK保存后清空 , 且不会回显。
## 3.2 时序库配置(使用SLS插件,支持SQL查询+组合算子查询)
时序库也可以配置为SLS插件的形式,使用这种接入方式,则支持SQL查询时序库,以及使用PromQL算子查询时序库(详情请查阅:[时序查询语法简介](https://help.aliyun.com/document_detail/171763.html))。配置方式与1.1节一致,在LogStore中填写metricStore名称即可。
## 3.3 时序库配置(原生方式,使用Prometheus插件)
SLS的时序库支持原生Prometheus查询,因此可以直接使用原生Prometheus插件进行数据源接入。请参考如下[官方文档](https://help.aliyun.com/document_detail/173903.html)配置数据源。日志服务MetricStore的URL,格式为**https://{project}.{sls-endpoint}/prometheus/{project}/{metricstore}**。其中_{sls-endpoint}_为Project所在地域的Endpoint,详情请参见[服务入口](https://help.aliyun.com/document_detail/29008.htm#reference-wgx-pwq-zdb),_{project}_和_{metricstore}_为您已创建的日志服务的Project和Metricstore,请根据实际值替换。例如:**https://sls-prometheus-test.cn-hangzhou.log.aliyuncs.com/prometheus/sls-prometheus-test/prometheus**
**从最佳实践角度:时序库可以同时添加Prometheus数据源与SLS数据源,查询时可根据个人习惯任意使用不同的语句查询方式,在Variable中推荐使用SLS数据源(支持与SLS仪表盘互相转化)**
# 4. 使用
## 4.1 仪表盘变量
### 4.1.1 Grafana变量在query中的写法
从实践上,唯一推荐的写法是:`${var_name}`。
从理论上,Grafana支持3种写法,分别是`$varname`、`${var_name}`、`[[varname]]`。但是不加大括号的写法有可能会变量名范围识别错误、双中扩号的写法在未来将会逐步抛弃。[参考来源](https://grafana.com/docs/grafana/latest/dashboards/variables/variable-syntax/)。
### 4.1.2 一般用法与全选配置
对于大部分SLS DataSource,可以通过SQL语句查询值,将其作为变量。步骤:
- 进入Grafana仪表盘的设置 - Variables
- 类型选择Query、Datasource配置为对应LogStore、书写query
- 在Preview of values中查看结果
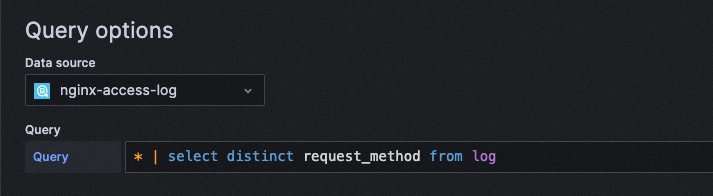

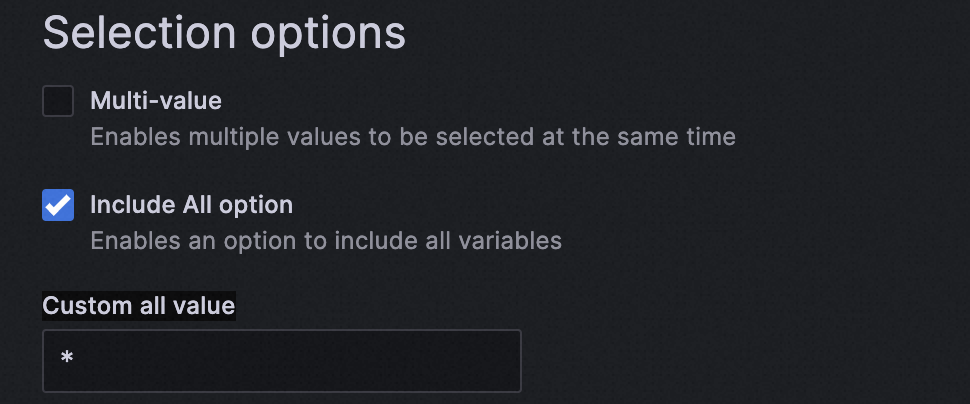
通常,如果作为日志库筛选用,实践中推荐打开`All Option`,并将Custom all value配置为`*`。
这样在Dashboard Query语句中,按照如下写法:`* and request_method: ${var} | select * from log`即可支持Variable选择与全选。
### 4.1.3 时序数据在SLS插件中的Variable配置
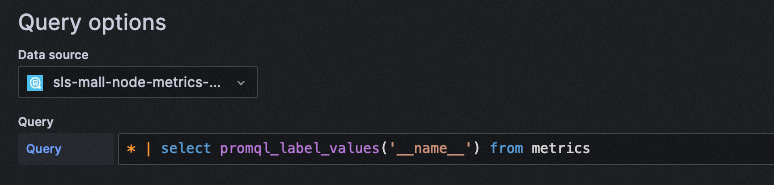
在配置SLS存储数据源中提到, SLS时序库支持Prometheus原生方式配置,也支持SLS插件方式配置。若使用SLS插件配置,则通常需要搭配promql算子,其使用方式与语法详见:[时序数据查询和分析简介](https://help.aliyun.com/document_detail/171763.html)。
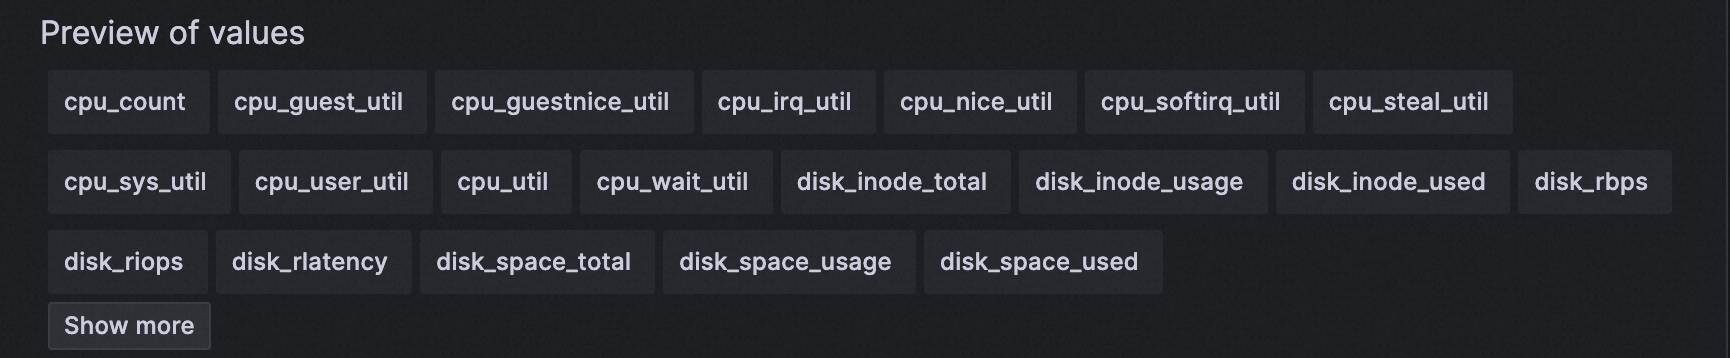
以下给出一个示例,该示例获取时序库中所有指标名。
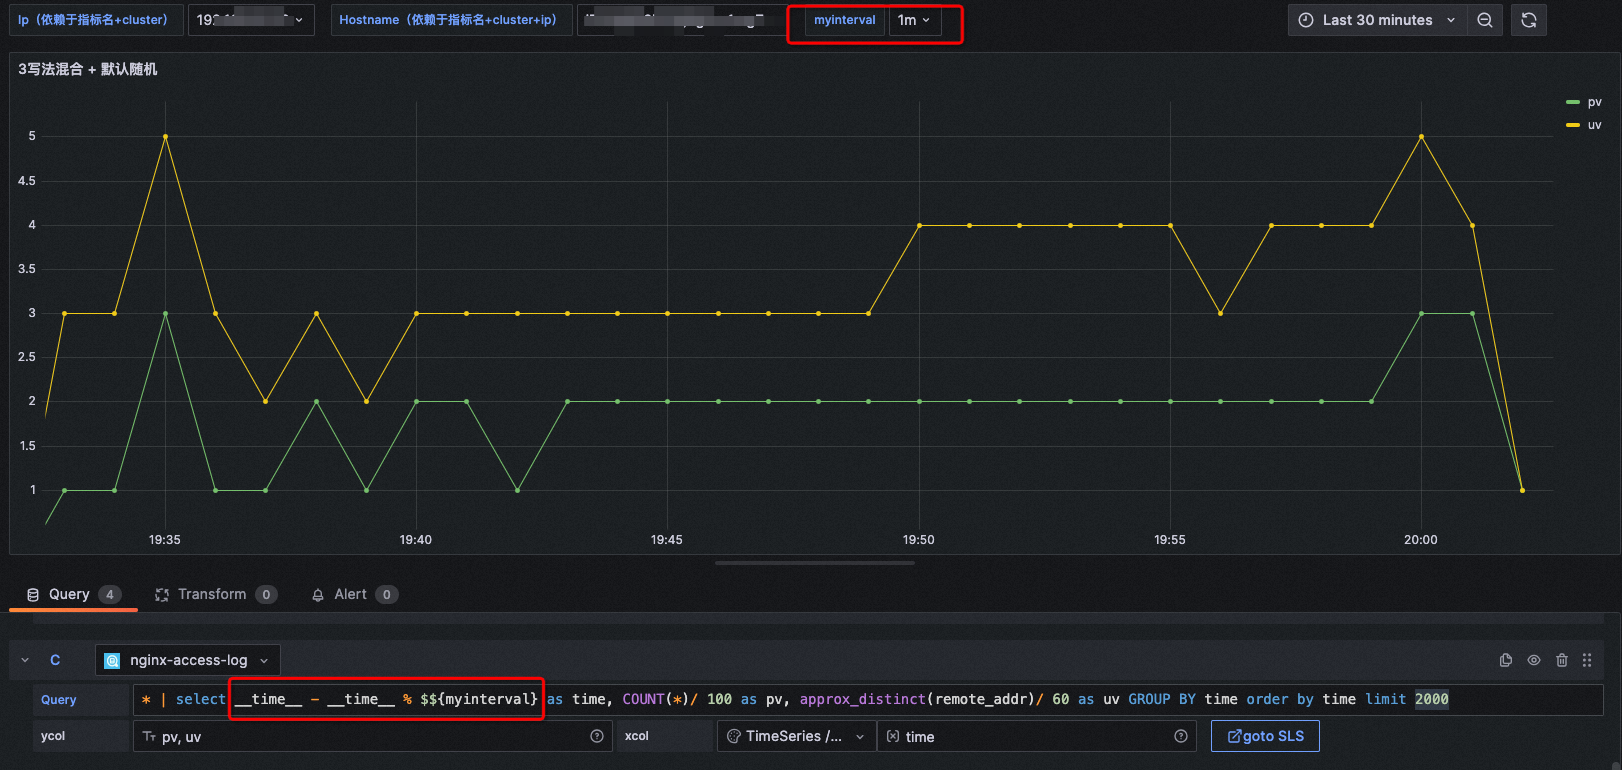
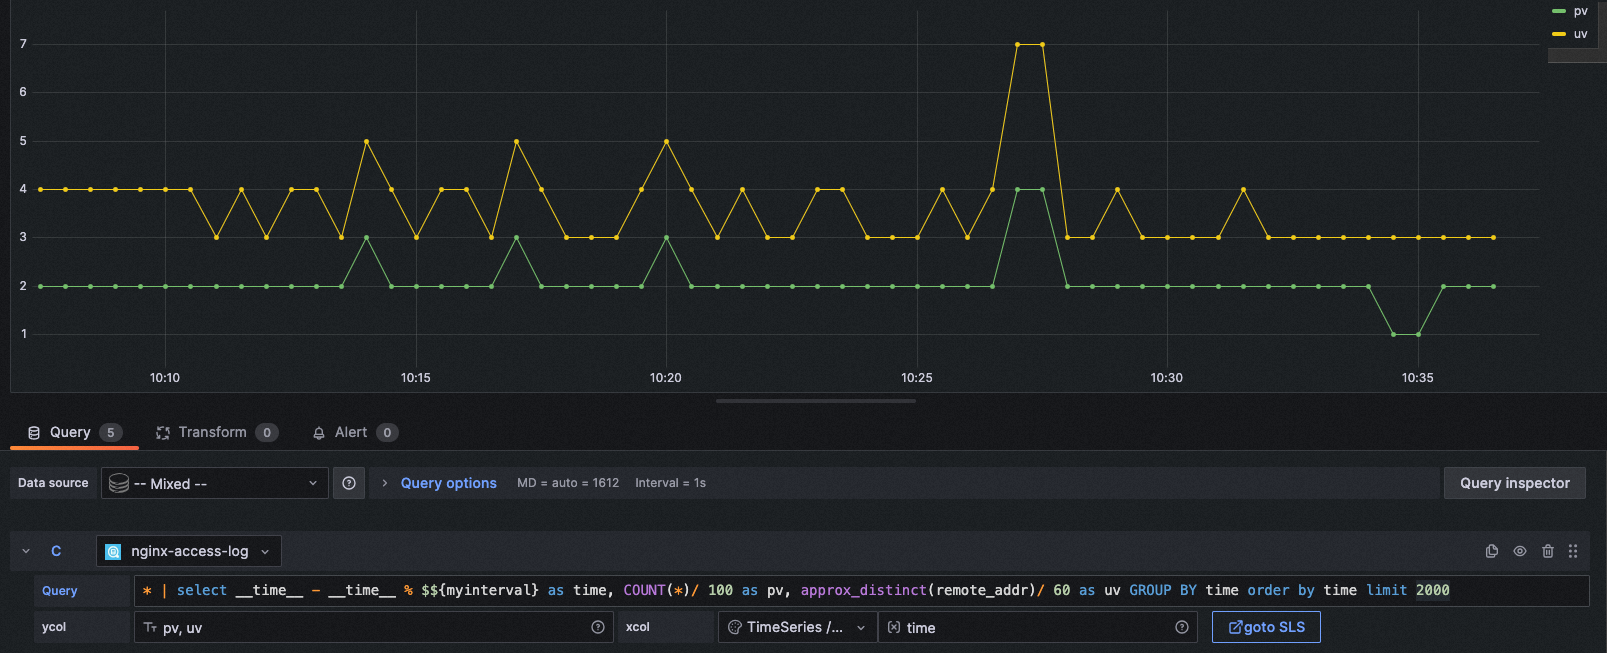
### 4.1.4 使用Interval变量根据时间跨度控制打点
首先配置一个Grafana 时间变量
| Name | 变量名称,例如myinterval。该名称是您配置中使用的变量,此处为myinterval,则查询条件中需写成**$$myinterval**。 |
| --- | --- |
| Type | 选择**Interval**。 |
| Label | 配置为**time interval**。 |
| Values | 配置为**1m,10m,30m,1h,6h,12h,1d,7d,14d,30d**。 |
| Auto Option | 打开**Auto Option**开关,其他参数保持默认配置。 |
**注意:该时间变量在SLS中不同于Grafana变量,需要在正常变量写法之前,再加上一个**`**$**`**符号,才能正确在SLS语句中转化Interval。**
```yaml
图表类型: TimeSeries
xcol: time
ycol: pv, uv
query: * | select __time__ - __time__ % $${myinterval} as time, COUNT(*)/ 100 as pv, approx_distinct(remote_addr)/ 60 as uv GROUP BY time order by time limit 2000
```
在配置为`1m`时显示为:
在配置为`10m`时显示为:
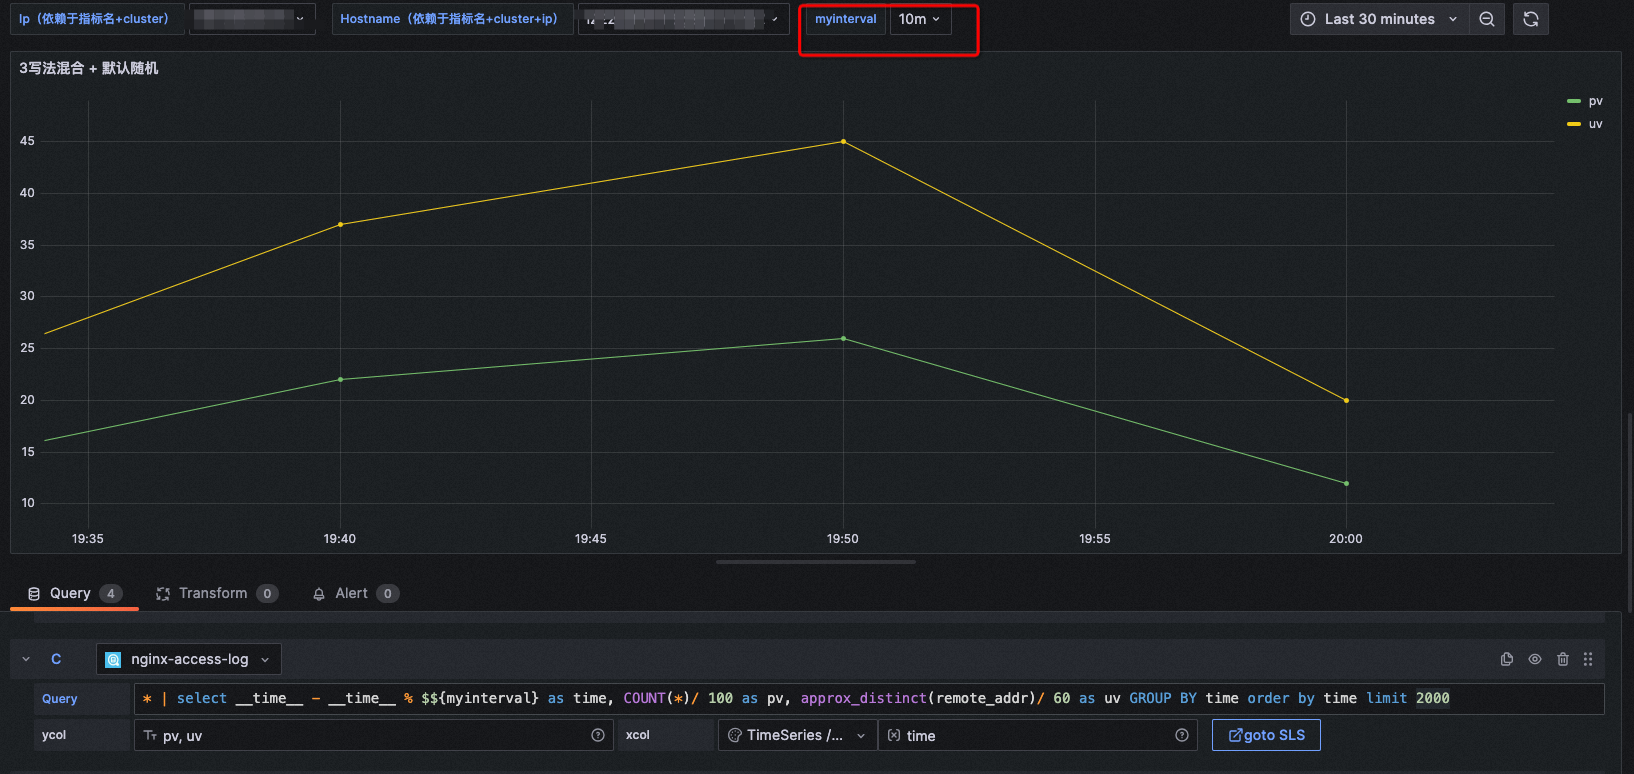
该功能在仪表盘时间范围选择非常长的时候,可以很方便地进行时间打点密度的控制。
## 4.2 图表标准写法概览
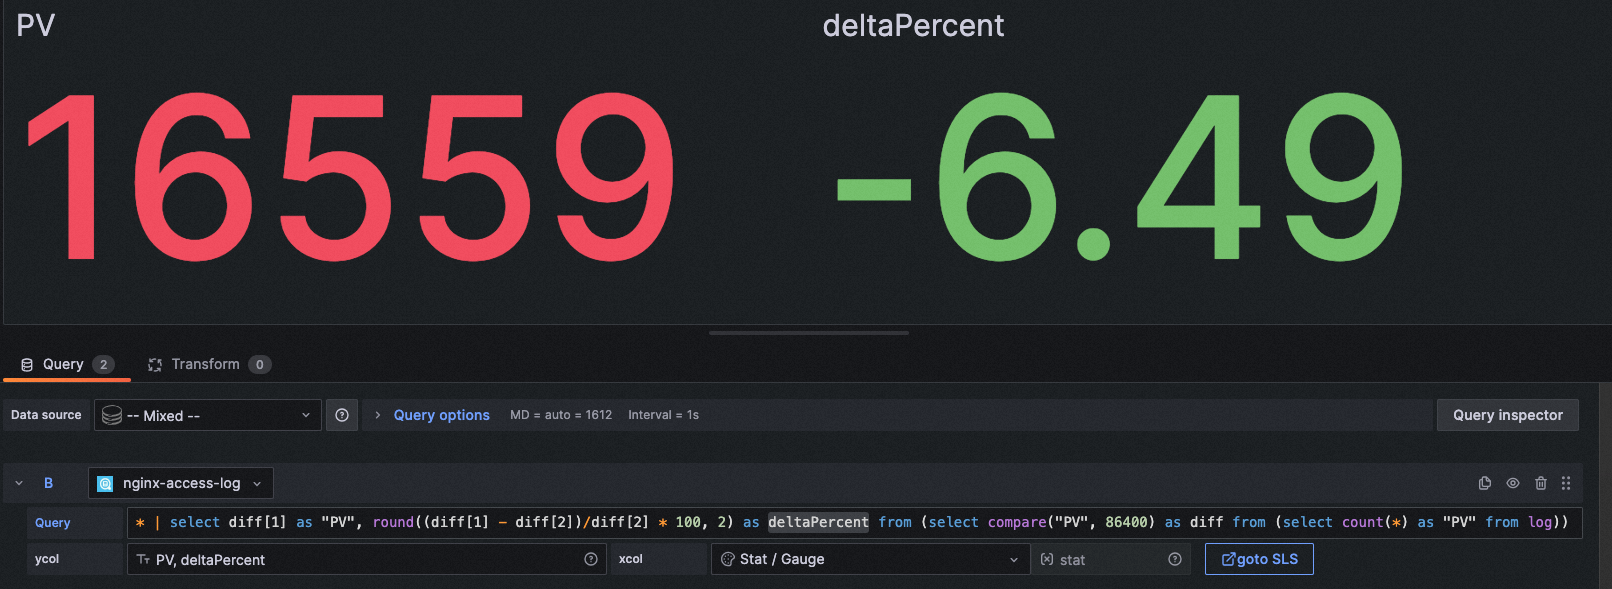
### 4.2.1 单值图(Stat / Gauge)
xcol写法:`stat`
ycol写法:`<数值列>, <数值列>`
注意:图中要求的数值列若提供的是非数值列,会直接置0。
示例1:
```yaml
图表类型: Stat
xcol: stat
ycol: PV, deltaPercent
query: * | select diff[1] as "PV", round((diff[1] - diff[2])/diff[2] * 100, 2) as deltaPercent from (select compare("PV", 86400) as diff from (select count(*) as "PV" from log))
```
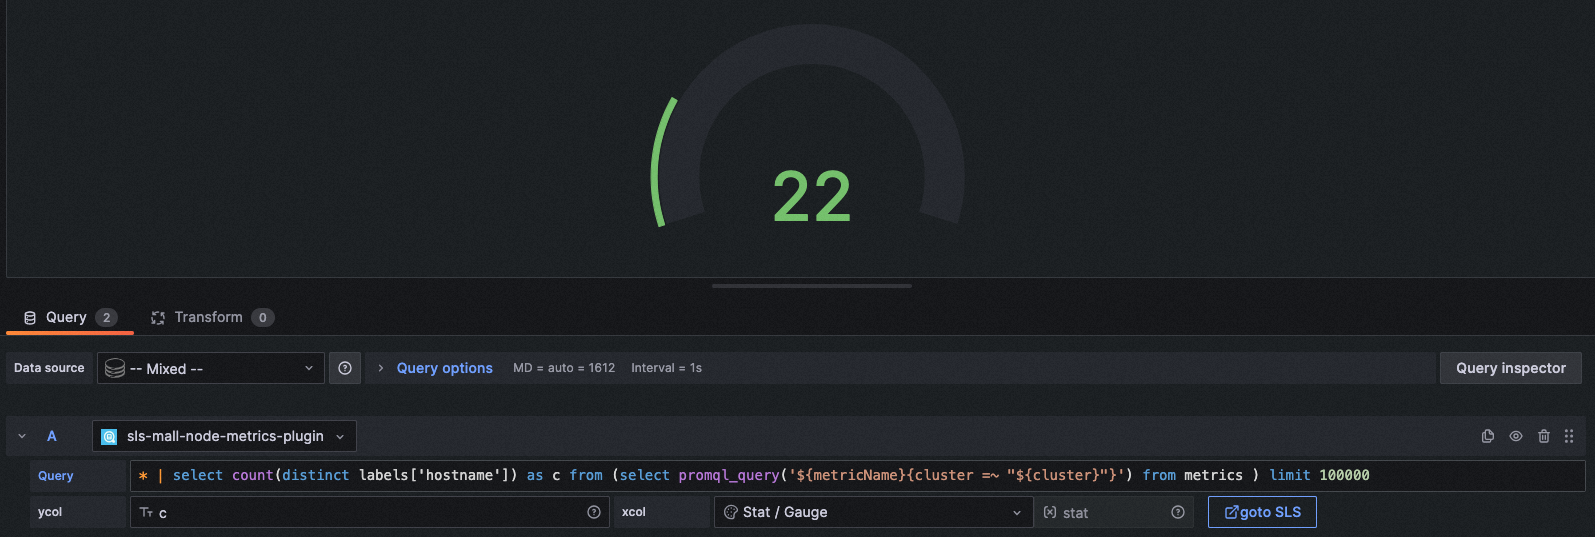
示例2:
```yaml
图表类型: Gauge
xcol: stat
ycol: c
query: * | select count(distinct labels['hostname']) as c from (select promql_query('${metricName}{cluster =~ "${cluster}"}') from metrics ) limit 100000
```
其他场景:
在线图场景下也可以显示为单值图,但不推荐这种写法。
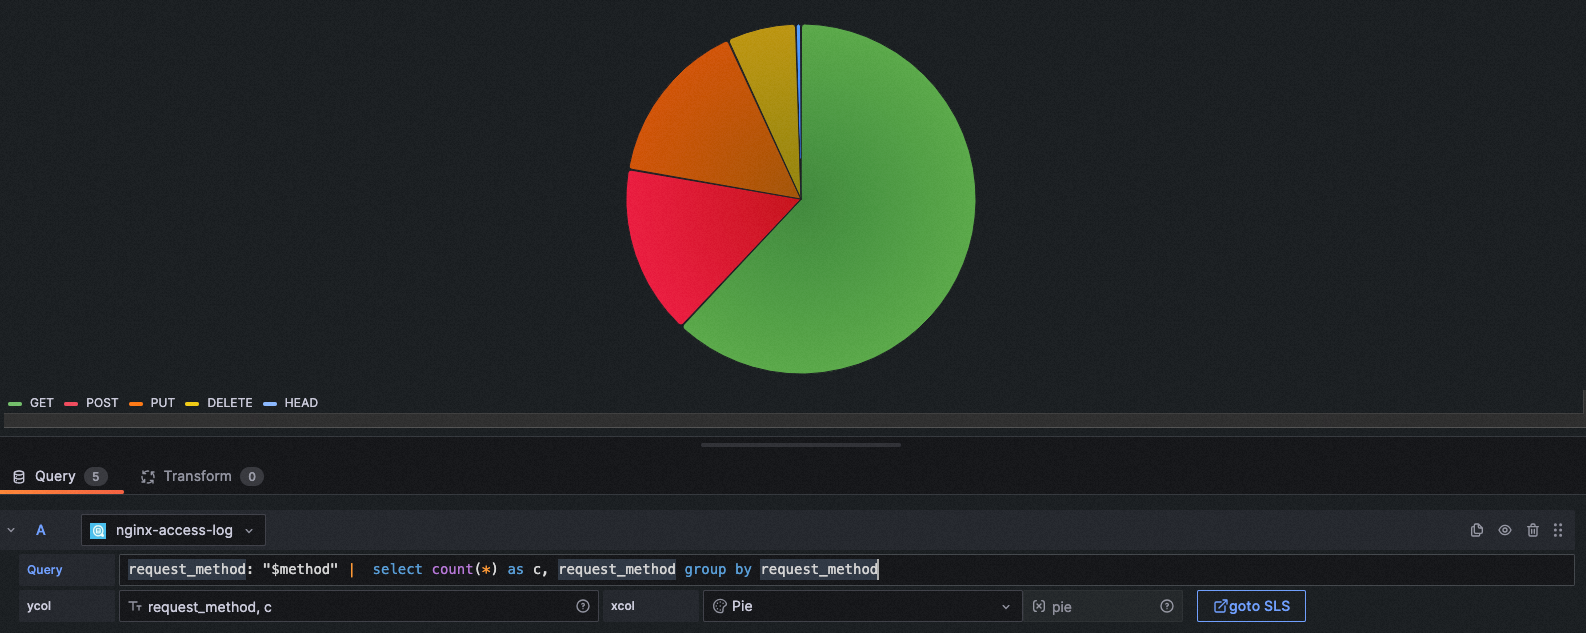
### 4.2.2 饼图(Pie)
xcol写法:`pie`
ycol写法:`<聚合列>, <数值列>`
示例1:
```yaml
图表类型: Pie
xcol: pie
ycol: request_method, c
query: request_method: "$method" | select count(*) as c, request_method group by request_method
```
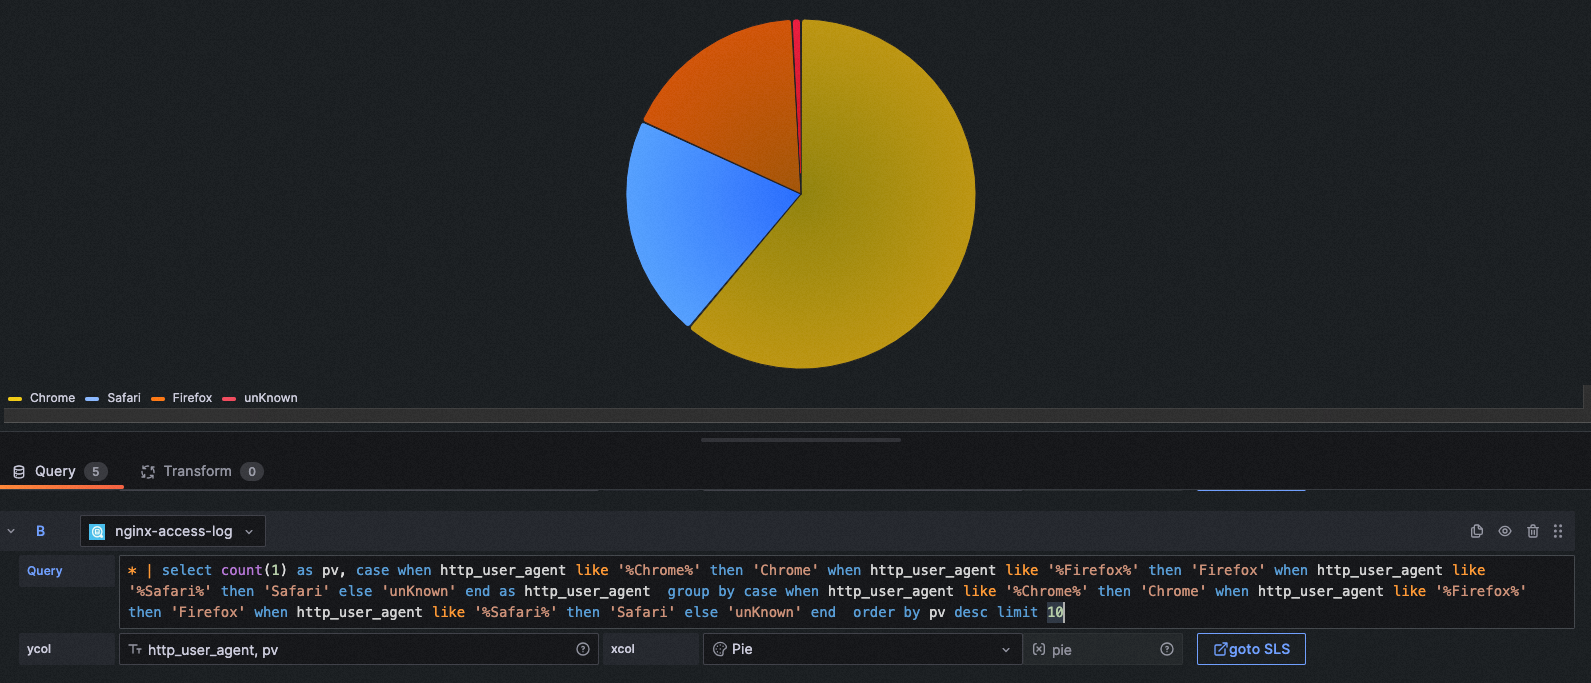
示例2:
```yaml
图表类型: Pie
xcol: pie
ycol: http_user_agent, pv
query: * | select count(1) as pv, case when http_user_agent like '%Chrome%' then 'Chrome' when http_user_agent like '%Firefox%' then 'Firefox' when http_user_agent like '%Safari%' then 'Safari' else 'unKnown' end as http_user_agent group by case when http_user_agent like '%Chrome%' then 'Chrome' when http_user_agent like '%Firefox%' then 'Firefox' when http_user_agent like '%Safari%' then 'Safari' else 'unKnown' end order by pv desc limit 10
```
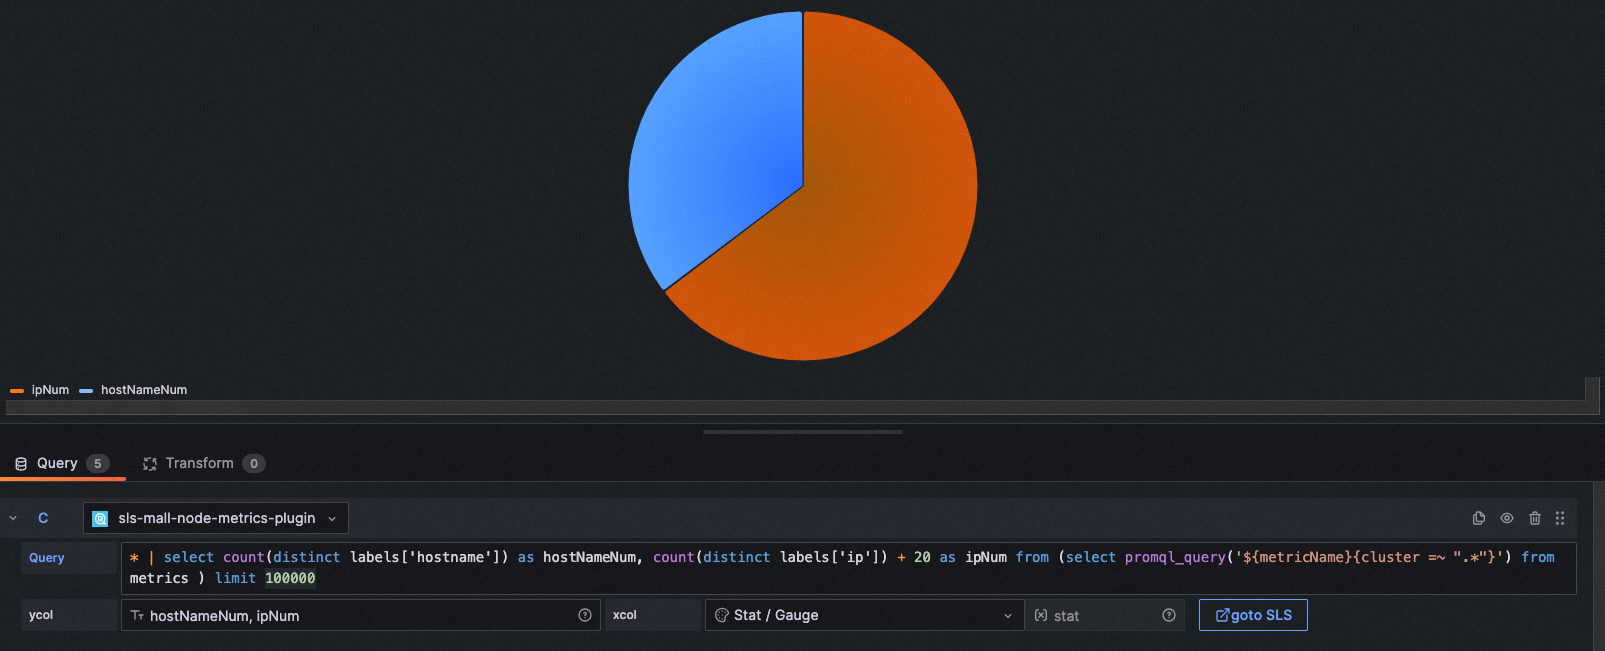
其他场景:
Stat图的写法也适用于饼图,也可以展示出效果。
```yaml
图表类型: Pie
xcol: stat
ycol: hostNameNum, ipNum
query: * | select count(distinct labels['hostname']) as hostNameNum, count(distinct labels['ip']) + 20 as ipNum from (select promql_query('${metricName}{cluster =~ ".*"}') from metrics ) limit 100000
```
### 4.2.3 线图(TimeSeries)
xcol写法:`<时间列>`
ycol写法:`<数值列> [, <数值列>, ...]`(日志写法)`#:#<数值列>`(时序库写法或日志聚合写法)
示例1:
```yaml
图表类型: Time series
xcol: time
ycol: pv, uv
query: * | select __time__ - __time__ % $${myinterval} as time, COUNT(*)/ 100 as pv, approx_distinct(remote_addr)/ 60 as uv GROUP BY time order by time limit 2000
```
示例2:
```yaml
图表类型: Time series
xcol: time
ycol: labels#:#value
query: * | select time, * from (select promql_query_range('${metricName}') from metrics) limit 1000
```
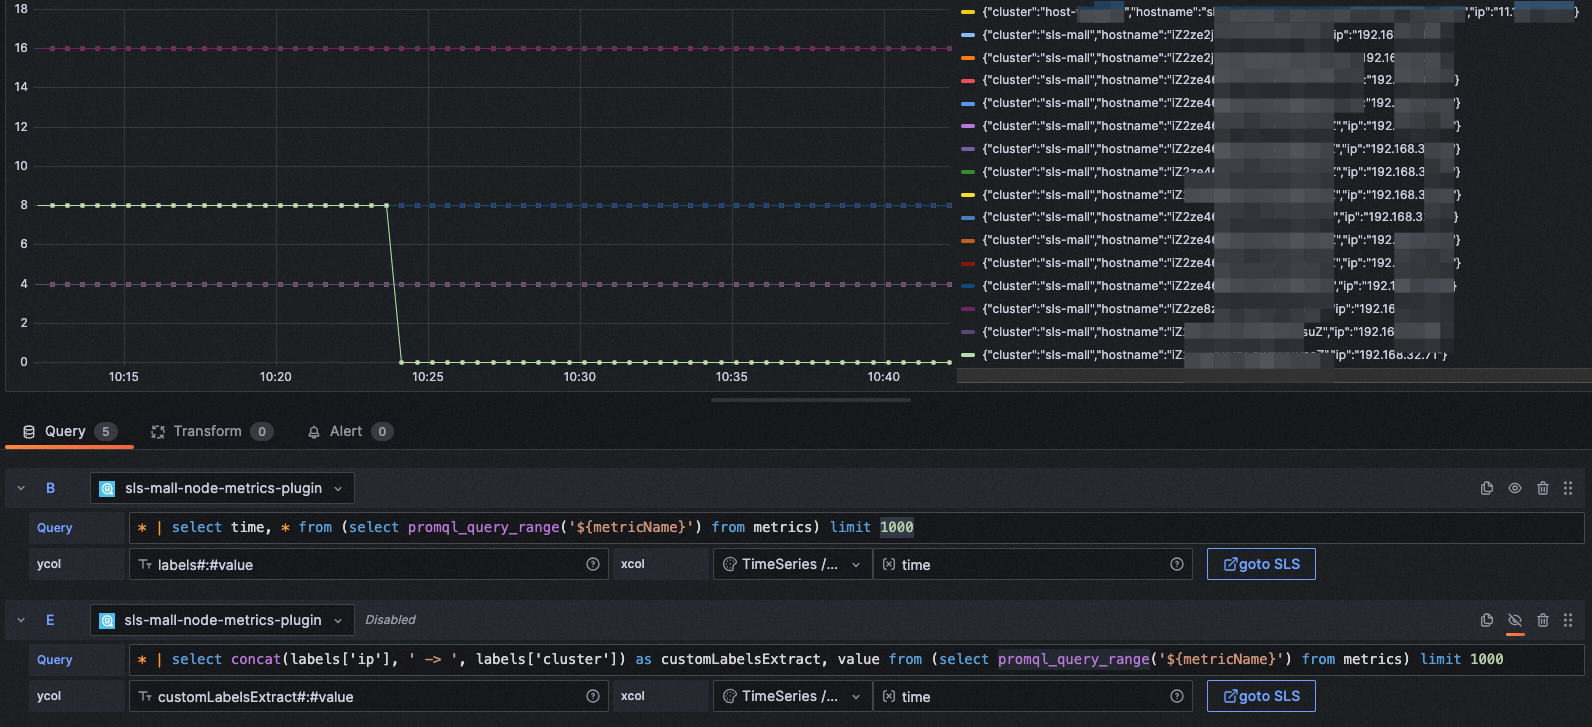
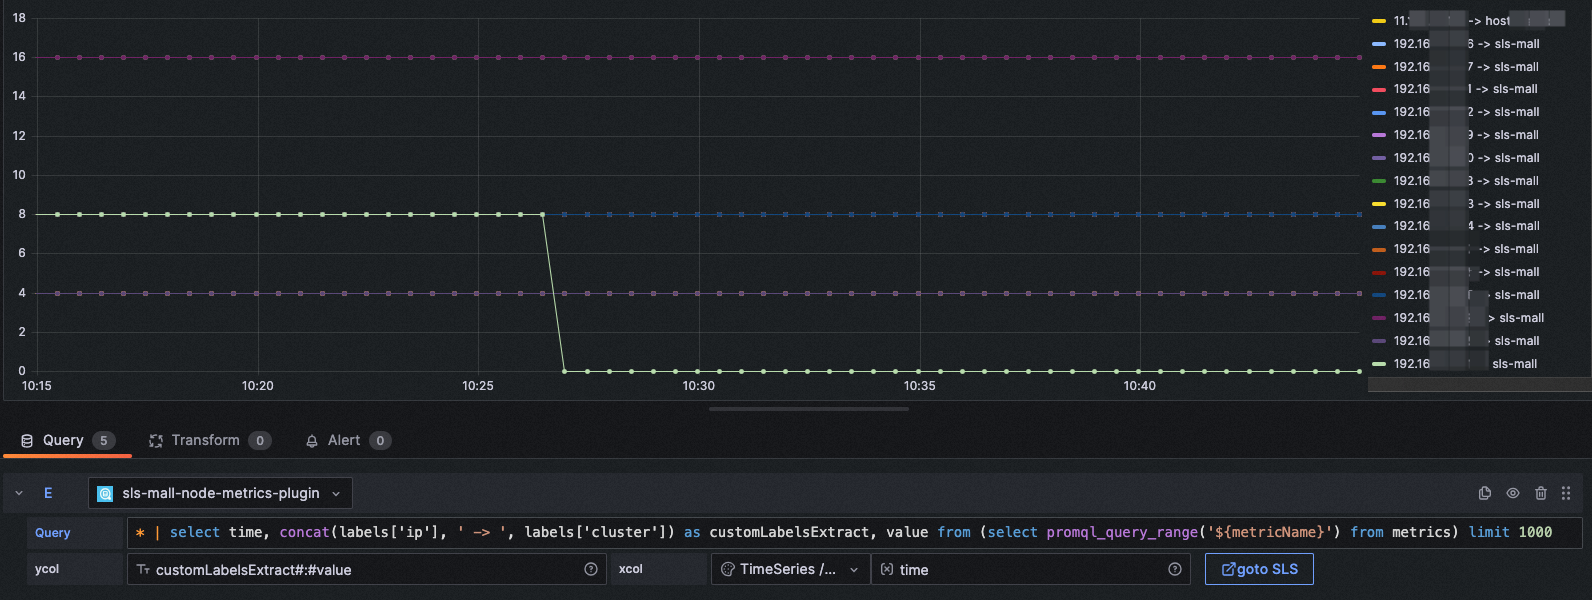
示例3:
也可以通过sql对时序labels进行自定义展示。
```yaml
图表类型: Time series
xcol: time
ycol: customLabelsExtract#:#value
query: * | select concat(labels['ip'], ' -> ', labels['cluster']) as customLabelsExtract, value from (select promql_query_range('${metricName}') from metrics) limit 1000
```
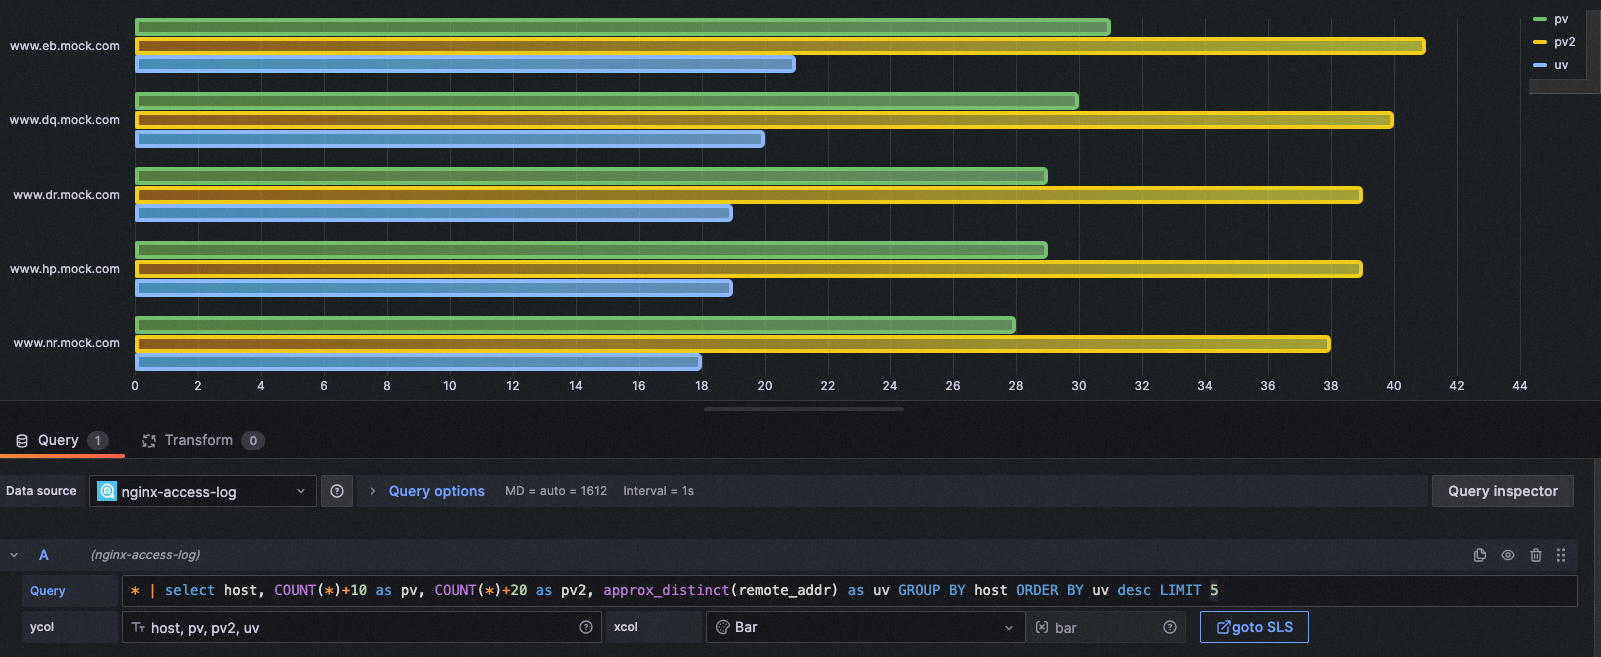
### 4.2.4 柱状图(Bar)
xcol写法:`bar`
ycol写法:`<聚合列>, <数值列> [, <数值列>, ...]`
示例1:
```yaml
图表类型: Bar
xcol: bar
ycol: host, pv, pv2, uv
query: * | select host, COUNT(*)+10 as pv, COUNT(*)+20 as pv2, approx_distinct(remote_addr) as uv GROUP BY host ORDER BY uv desc LIMIT 5
```
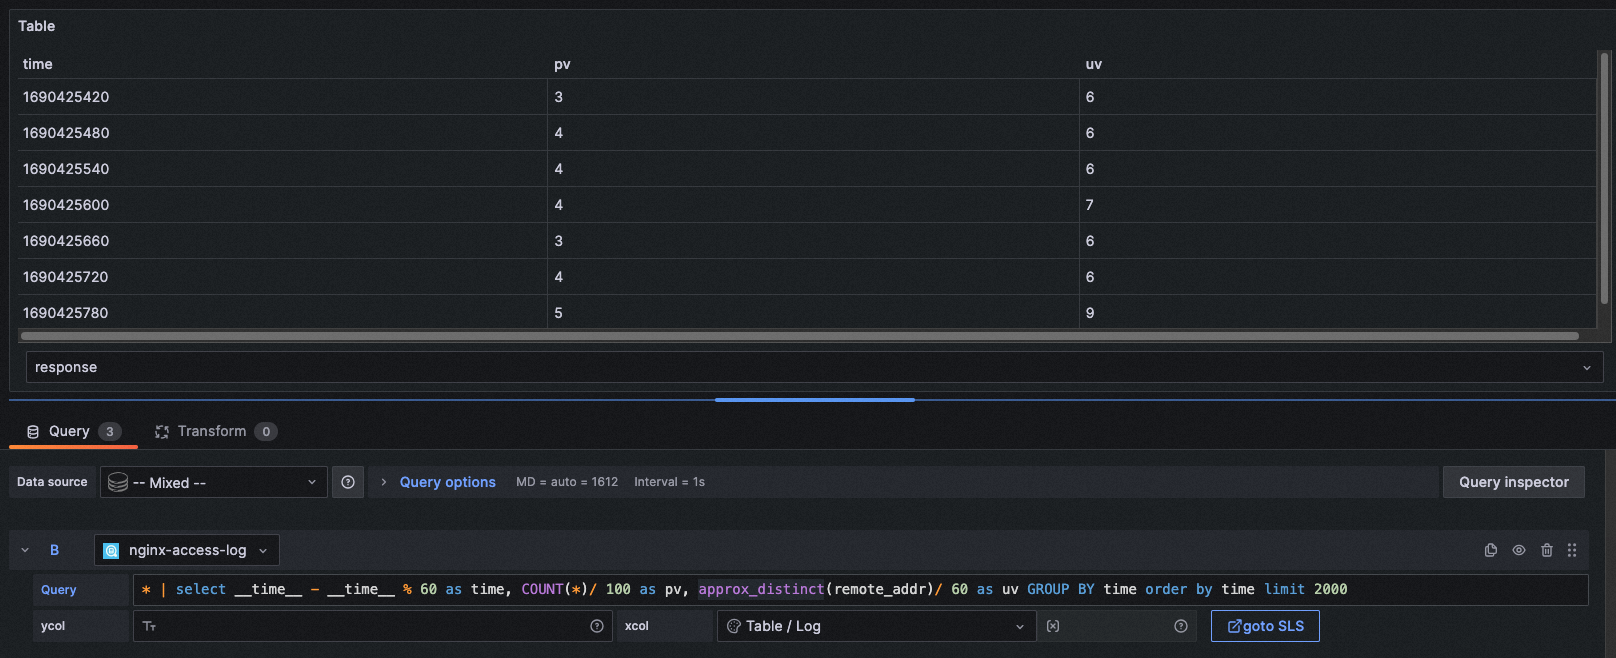
### 4.2.5 表格(Table)
xcol写法:`<空>`
ycol写法:`<空> 或者 <展示列> [, <展示列>, ...]`
示例1:
```yaml
图表类型: Table
xcol:
ycol:
query: * | select __time__ - __time__ % 60 as time, COUNT(*)/ 100 as pv, approx_distinct(remote_addr)/ 60 as uv GROUP BY time order by time limit 2000
```
### 4.2.6 日志(Log)
xcol写法:`<空>`
ycol写法:`<空>`
示例1:
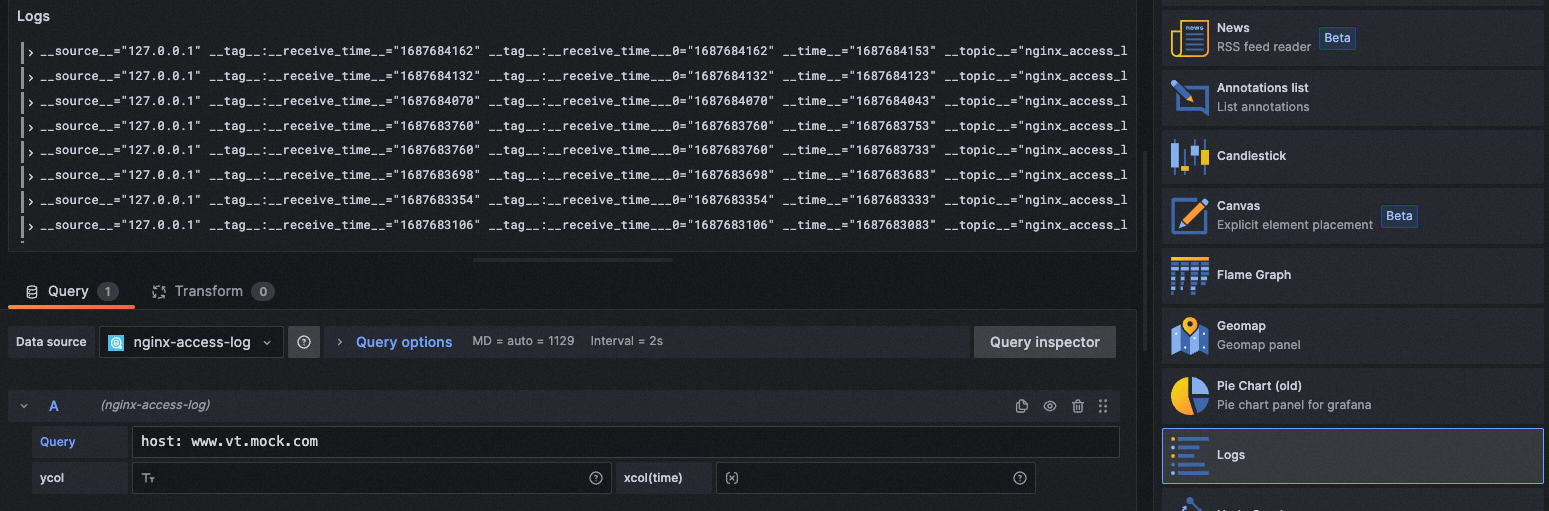
```yaml
图表类型: Logs
xcol:
ycol:
query: host: www.vt.mock.com
```
### 4.2.7 Trace(Traces)
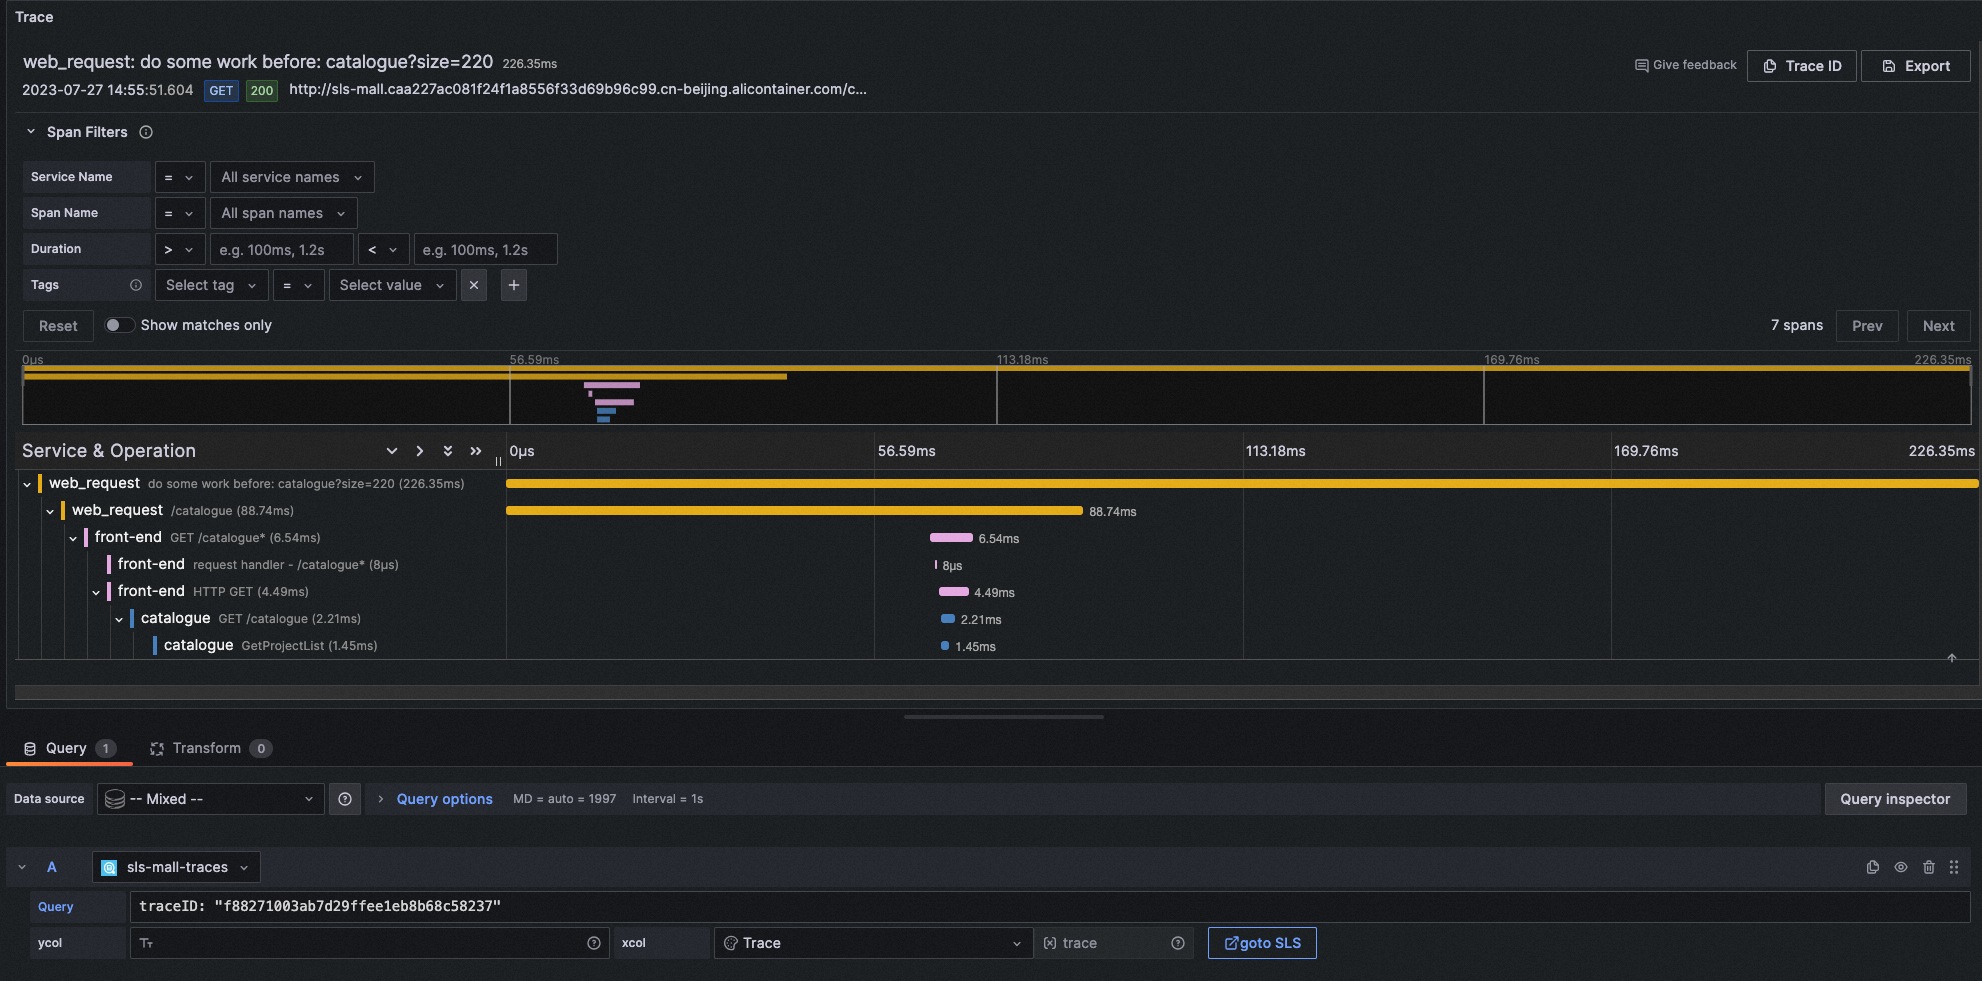
```yaml
图表类型: Traces
xcol: trace
ycol:
query: traceID: "f88271003ab7d29ffee1eb8b68c58237"
```
该示例中使用了Trace的日志库,需要您在SLS使用Trace服务,日志服务支持OpenTelemetry Trace数据的原生接入,还支持通过其他Trace系统接入Trace数据。更多细节请参见:[https://help.aliyun.com/document_detail/208894.html](https://help.aliyun.com/document_detail/208894.html)
在 Grafana 10.0 以上版本,支持Trace数据的span筛选功能,如果您使用的是低版本Grafana,也可以在query筛选中自定义span的筛选。例如:
```plsql
traceID: "f88271003ab7d29ffee1eb8b68c58237" and resource.deployment.environment : "dev" and service : "web_request" and duration > 10
```
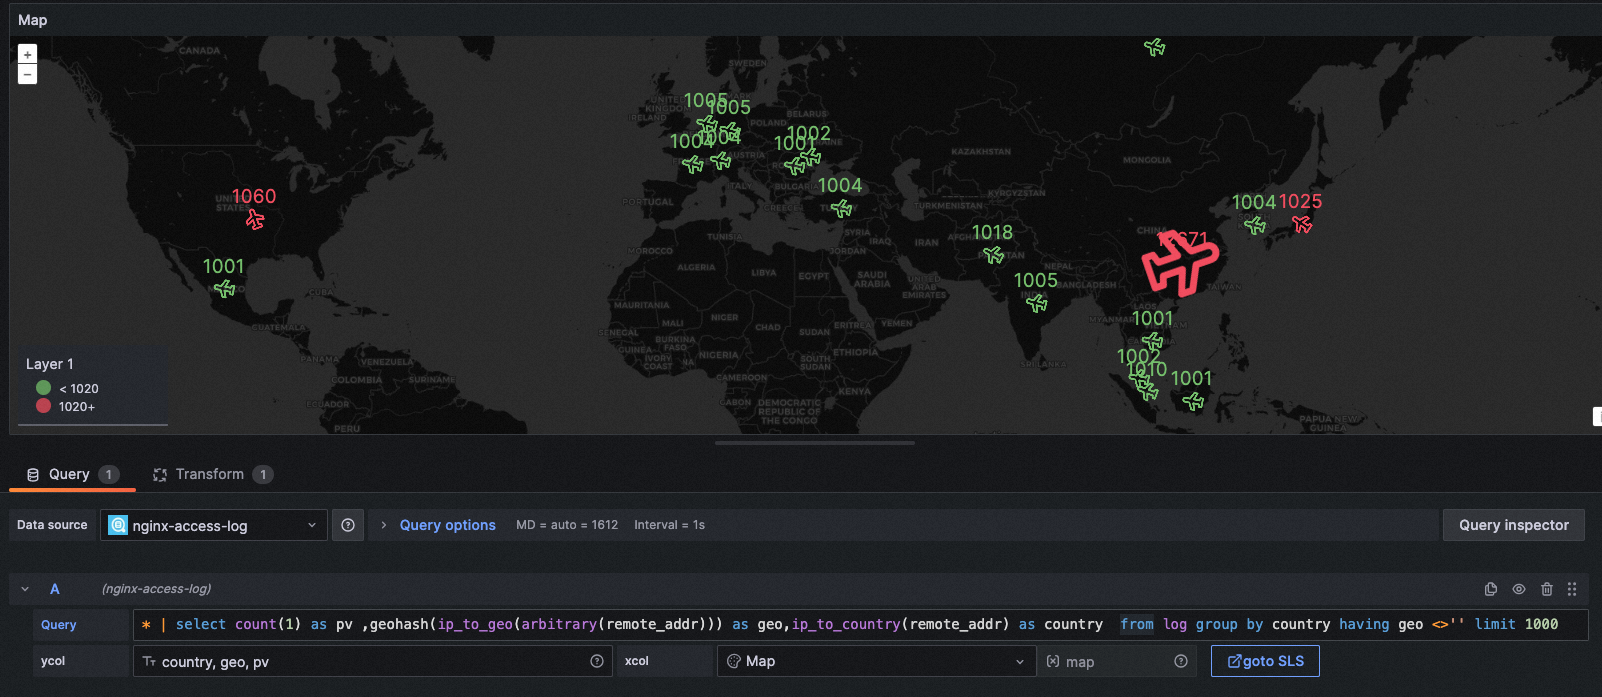
### 4.2.8 地图(Map)
xcol写法:`map`
ycol写法:`<国家列>, <地理位置列>, <数值列>`
示例1:
```yaml
图表类型: GeoMap
xcol: map
ycol: country, geo, pv
query: * | select count(1) as pv ,geohash(ip_to_geo(arbitrary(remote_addr))) as geo,ip_to_country(remote_addr) as country from log group by country having geo <>'' limit 1000
```
# 5. 一键跳转SLS控制台
注意:此功能在 SLS Grafana Plugin 2.30 版本及以上才可使用。
您可以在Explore界面和仪表盘界面中,随时跳转到SLS控制台进行比对了,同时也可以使用SLS控制台更强大的功能和更灵活的日志检索。
**跳转到SLS控制台,将附带query、时间信息,无需手动输入。**

此种跳转方式是直接跳转到SLS控制台,不涉及任何配置,但需要您的浏览器登录了SLS控制台,否则会显示登录页面。
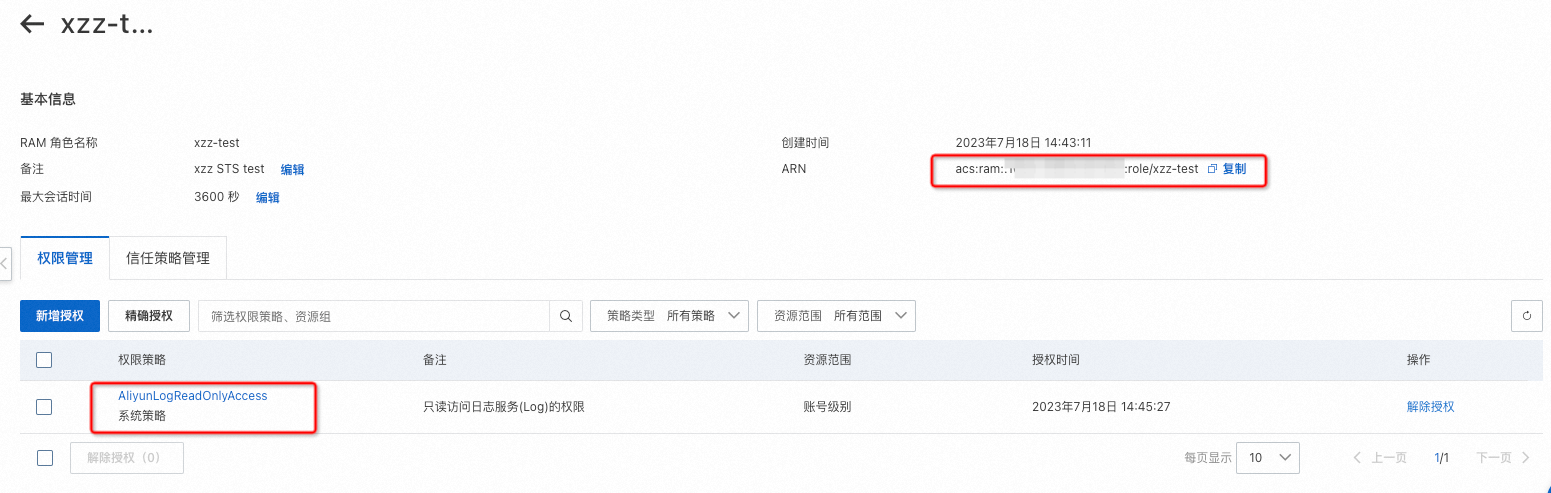
## 5.1 STS方式跳转(无需登录)
步骤:
1. 访问RAM控制台[https://ram.console.aliyun.com/roles/](https://ram.console.aliyun.com/roles/),创建一个**_有且只有AliyunLogReadOnlyAccess_**权限策略的角色。建议最大会话时间为3600秒。在基本信息处可复制roleArn信息。
2. 访问RAM控制台授权界面[https://ram.console.aliyun.com/permissions](https://ram.console.aliyun.com/permissions),给在Grafana DataSource配置的AccessKey对应的用户,赋予AliyunRAMReadOnlyAccess、AliyunSTSAssumeRoleAccess权限。(或更换Grafana DataSource配置的AccessKey、AccessSecret,必须保证用户有该权限)

3. 在DataSource界面配置roleArn。
4. 再次回到Explore界面,尝试gotoSLS按钮,即可免登STS跳转。
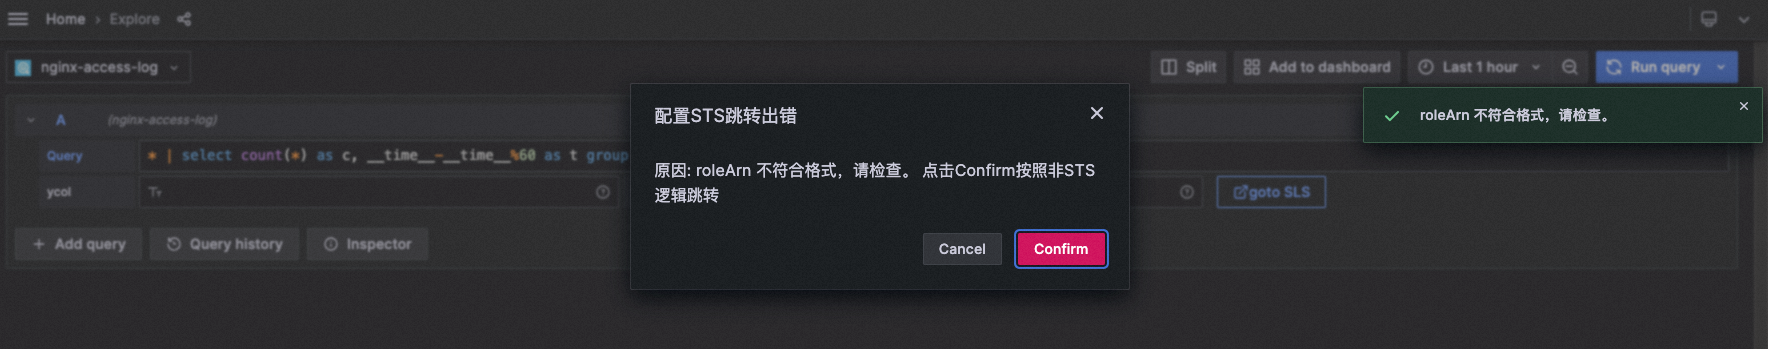
注意:如果配置的roleArn有误、权限范围有误,均会导致免登失效,将仍按照一般逻辑进行跳转。
## 5.2 注意事项和风险警告⚠️
若配置STS跳转,为权限安全考虑,需要满足以下两个条件:
- 配置DataSource的accessKey对应的用户,需要有`AliyunRAMReadOnlyAccess`权限、`AliyunSTSAssumeRoleAccess`权限
- 配置DataSource的roleArn,里面的权限策略,必须**有且只有**`AliyunLogReadOnlyAccess`
原理参考:[控制台内嵌及分享](https://help.aliyun.com/document_detail/74971.html)
**如果您配置了免登跳转,请一定要注意数据源是否涉及Grafana仪表盘公开访问的分享,如果涉及公开访问,可能会造成潜在的流量成本上升、潜在的日志内容公开暴露。**
# 6. 持续更新的常见疑问
## 6.1 为什么在SLS上可以显示图表,在Grafana上显示不了
- 排查xcol、ycol是否配置规范,详情见本文第4章。
- 将xcol、ycol置空,已表格形式查看数据是否正确。
- 排查是否数值列中混有非数字字符或特殊字符。
- Query Inspector中查看是否有数据返回。
- 联系我们查看此问题。
## 6.2 为什么会产生时间漂移,时间显示不对?
请检查SQL语句中是否包含date_format函数,如果是,则需要在模式串中规范为:`%Y-%m-%d %H:%i:%s`
例如出问题的语句为:
```sql
* | SELECT date_format(date_trunc('minute', __time__), '%H:%i') AS time, COUNT(1) AS count, status GROUP BY time, status ORDER BY time
```
需要更改为:
```sql
* | SELECT date_format(date_trunc('minute', __time__), '%Y-%m-%d %H:%i:%s') AS time, COUNT(1) AS count, status GROUP BY time, status ORDER BY time
```
## 6.3 如何联系日志服务
钉钉群