# Leaflet.PolylineMeasure
**Repository Path**: opengis-leaflet/Leaflet.PolylineMeasure
## Basic Information
- **Project Name**: Leaflet.PolylineMeasure
- **Description**: No description available
- **Primary Language**: Unknown
- **License**: BSD-2-Clause
- **Default Branch**: master
- **Homepage**: None
- **GVP Project**: No
## Statistics
- **Stars**: 0
- **Forks**: 1
- **Created**: 2021-07-31
- **Last Updated**: 2022-08-08
## Categories & Tags
**Categories**: Uncategorized
**Tags**: None
## README
# Leaflet.PolylineMeasure
* Leaflet Plugin to **measure distances** of simple lines as well as of complex polylines.
* Measuring in **metric system** (metre, kilometre), in **imperial system** (foot, landmile), or in **nautical miles**.
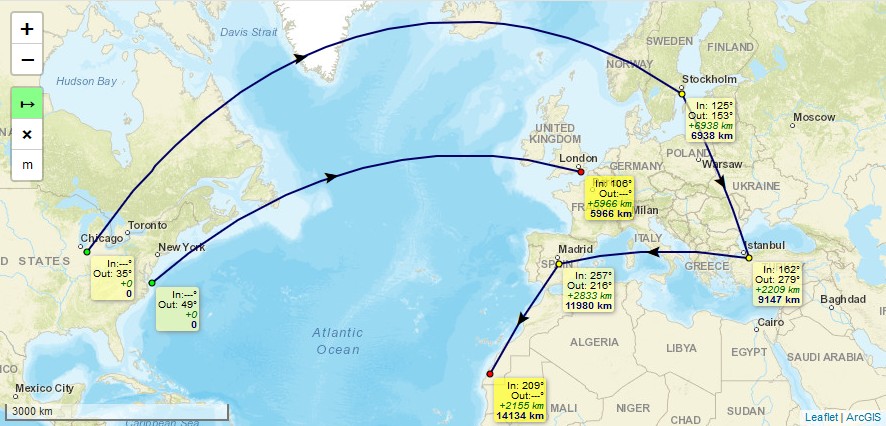
* Lines are drawn as realistic arcs. **Bearings** and **distances** are calculated considering [**Great-circle distance**](https://en.wikipedia.org/wiki/Great-circle_distance) which is the shortest path between 2 points on Earth.
* **Arrows** indicating the **real midways** of the line's great-circle **distances**, not their optical middle which is different due to projection, especially in high latitudes.
* To **finish** drawing a line just *doubleclick*, or *singleclick* onto the last (=orange) point, or *press "ESC"-key*.
* **Moving** of line's points afterwards is possible by clicking and draging them. *(This feature can not be guaranteed to work on every **mobile** browser using touch input, e.g. with Chrome Mobile it isn't working right now)*
* To **continue** a line after it has been finished, hold the *Ctrl-Key* while clicking onto the first or last point of a line.
* To **add** points, hold the *Ctrl-Key* while clicking onto an arrow.
* To **delete** points, hold the *Shift-Key* while clicking onto a point.
* It is an evolution of jtreml's Plugin [leaflet.measure](https://github.com/jtreml/leaflet.measure) since the original plugin hasn't been bugfixed for years. I modified it to work again with **Leaflet v1.0 and newer** (still runs with Leaflet v0.7) and added functional and optical improvements.
## Demos
* Please take a look at these demos:
- [**Demo 1**](https://ppete2.github.io/Leaflet.PolylineMeasure/demo1.html) (metre units, bearings, with Clear-button and Units-button)
- [**Demo 2**](https://ppete2.github.io/Leaflet.PolylineMeasure/demo2.html) (landmile units, without bearings, without Unit-button)
- [**Demo 3**](https://ppete2.github.io/Leaflet.PolylineMeasure/demo3.html) (nauticalmile units, bearings, without Unit-button and Clear-button)
- [**Demo 4**](https://ppete2.github.io/Leaflet.PolylineMeasure/demo4.html) (two maps)
- [**Demo 5**](https://ppete2.github.io/Leaflet.PolylineMeasure/demo5.html) (programatically providing polyline points)
## Usage
Add 2 code lines within your **HTML-file** to load the .css and .js files of the plugin:
```html
```
Add 1 code line within your **Javascript-file** to add the plugin's control into your Leaflet map.
```js
L.control.polylineMeasure(options).addTo(map);
```
## Package manager install
It's possible to install and update this plugin using package managers like `npm`. These optional feature got added by other users. I'm not familiar with nor responsible to keep these optional package manager installs up-to-date. If you notice that such installs are outdated, feel free to provide a Pull request or contact one of the persons who once introduced those install variants, thanks.
## Default options
```js
options = {
position: 'topleft', // Position to show the control. Values: 'topright', 'topleft', 'bottomright', 'bottomleft'
unit: 'metres', // Show imperial or metric distances. Values: 'metres', 'landmiles', 'nauticalmiles'
clearMeasurementsOnStop: true, // Clear all the measurements when the control is unselected
showBearings: false, // Whether bearings are displayed within the tooltips
bearingTextIn: 'In' // language dependend label for inbound bearings
bearingTextOut: 'Out', // language dependend label for outbound bearings
tooltipTextFinish: 'Click to finish line ',
tooltipTextDelete: 'Press SHIFT-key and click to delete point',
tooltipTextMove: 'Click and drag to move point ',
tooltipTextResume: ' Press CTRL-key and click to resume line',
tooltipTextAdd: 'Press CTRL-key and click to add point',
// language dependend labels for point's tooltips
measureControlTitleOn: 'Turn on PolylineMeasure', // Title for the control going to be switched on
measureControlTitleOff: 'Turn off PolylineMeasure', // Title for the control going to be switched off
measureControlLabel: '↦', // Label of the Measure control (maybe a unicode symbol)
measureControlClasses: [], // Classes to apply to the Measure control
showClearControl: false, // Show a control to clear all the measurements
clearControlTitle: 'Clear Measurements', // Title text to show on the clear measurements control button
clearControlLabel: '×', // Label of the Clear control (maybe a unicode symbol)
clearControlClasses: [], // Classes to apply to clear control button
showUnitControl: false, // Show a control to change the units of measurements
distanceShowSameUnit: false, // Keep same unit in tooltips in case of distance less then 1 km/mi/nm
unitControlTitle: { // Title texts to show on the Unit Control button
text: 'Change Units',
metres: 'metres',
landmiles: 'land miles',
nauticalmiles: 'nautical miles'
},
unitControlLabel: { // Unit symbols to show in the Unit Control button and measurement labels
metres: 'm',
kilometres: 'km',
feet: 'ft',
landmiles: 'mi',
nauticalmiles: 'nm'
},
tempLine: { // Styling settings for the temporary dashed line
color: '#00f', // Dashed line color
weight: 2 // Dashed line weight
},
fixedLine: { // Styling for the solid line
color: '#006', // Solid line color
weight: 2 // Solid line weight
},
startCircle: { // Style settings for circle marker indicating the starting point of the polyline
color: '#000', // Color of the border of the circle
weight: 1, // Weight of the circle
fillColor: '#0f0', // Fill color of the circle
fillOpacity: 1, // Fill opacity of the circle
radius: 3 // Radius of the circle
},
intermedCircle: { // Style settings for all circle markers between startCircle and endCircle
color: '#000', // Color of the border of the circle
weight: 1, // Weight of the circle
fillColor: '#ff0', // Fill color of the circle
fillOpacity: 1, // Fill opacity of the circle
radius: 3 // Radius of the circle
},
currentCircle: { // Style settings for circle marker indicating the latest point of the polyline during drawing a line
color: '#000', // Color of the border of the circle
weight: 1, // Weight of the circle
fillColor: '#f0f', // Fill color of the circle
fillOpacity: 1, // Fill opacity of the circle
radius: 3 // Radius of the circle
},
endCircle: { // Style settings for circle marker indicating the last point of the polyline
color: '#000', // Color of the border of the circle
weight: 1, // Weight of the circle
fillColor: '#f00', // Fill color of the circle
fillOpacity: 1, // Fill opacity of the circle
radius: 3 // Radius of the circle
},
};
```
## Events
It fire some events during the measure in order to allow more interactivity with the app.
Subscribe to events with :
```js
map.on('polylinemeasure:toogle', e => { /* e.sttus */ });
map.on('polylinemeasure:start', currentLine => {...});
map.on('polylinemeasure:resume', currentLine => {...});
map.on('polylinemeasure:finish', currentLine => {...});
map.on('polylinemeasure:change', currentLine => {...});
map.on('polylinemeasure:clear', e => {...});
map.on('polylinemeasure:add', e => { /* e.latlng */ });
map.on('polylinemeasure:insert', e => { /* e.latlng */ });
map.on('polylinemeasure:move', e => { /* e.latlng ; e.sourceTarget._latlng */ });
map.on('polylinemeasure:remove', e => { /* e.latlng ; e.sourceTarget._latlng */ });
```
## Seeding Data
You can programatically draw measured polylines using the `.seed` method. It takes an array of arrays of `L.LatLng`, which enables drawing multiple, discontinuous polylines:
```js
let polylineMeasure = L.control.polylineMeasure(options);
polylineMeasure.addTo (map);
const line1coords = [
{ lat: 22.156883186860703, lng: -158.95019531250003 },
{ lat: 22.01436065310322, lng: -157.33520507812503 },
{ lat: 21.391704731036587, lng: -156.17065429687503 },
{ lat: 20.64306554672647, lng: -155.56640625000003 }
];
const line2coords = [
{ lat: 19.880391767822505, lng: -159.67529296875003 },
{ lat: 17.90556881196468, lng: -156.39038085937503 }
];
polylineMeasure.seed([line1coords, line2coords])
```
* Please take a look at [**Demo 5**](https://ppete2.github.io/Leaflet.PolylineMeasure/demo5.html), where multiple polylines are drawn and measured programatically.