math']
```
#### 13 非贪心捕获
仅添加一个问号(`?`),得到结果完全不同,这是非贪心匹配,通过这个例子体会贪心和非贪心的匹配的不同。
```python
content='
ddedadsadgraph
bb
math
cc'
pat=re.compile(r"
(.*?)
")
m=pat.findall(content)
print(m) # ['graph', 'math']
```
非贪心捕获,见好就收。
#### 14 常用元字符总结
. 匹配任意字符
^ 匹配字符串开始位置
$ 匹配字符串中结束的位置
* 前面的原子重复0次、1次、多次
? 前面的原子重复0次或者1次
+ 前面的原子重复1次或多次
{n} 前面的原子出现了 n 次
{n,} 前面的原子至少出现 n 次
{n,m} 前面的原子出现次数介于 n-m 之间
( ) 分组,需要输出的部分
#### 15 常用通用字符总结
\s 匹配空白字符
\w 匹配任意字母/数字/下划线
\W 和小写 w 相反,匹配任意字母/数字/下划线以外的字符
\d 匹配十进制数字
\D 匹配除了十进制数以外的值
[0-9] 匹配一个0-9之间的数字
[a-z] 匹配小写英文字母
[A-Z] 匹配大写英文字母
#### 14 密码安全检查
密码安全要求:1)要求密码为6到20位; 2)密码只包含英文字母和数字
```python
pat = re.compile(r'\w{6,20}') # 这是错误的,因为\w通配符匹配的是字母,数字和下划线,题目要求不能含有下划线
# 使用最稳的方法:\da-zA-Z满足`密码只包含英文字母和数字`
pat = re.compile(r'[\da-zA-Z]{6,20}')
```
选用最保险的`fullmatch`方法,查看是否整个字符串都匹配:
```python
pat.fullmatch('qaz12') # 返回 None, 长度小于6
pat.fullmatch('qaz12wsxedcrfvtgb67890942234343434') # None 长度大于22
pat.fullmatch('qaz_231') # None 含有下划线
pat.fullmatch('n0passw0Rd')
Out[4]:
```
#### 15 爬取百度首页标题
```python
import re
from urllib import request
#爬虫爬取百度首页内容
data=request.urlopen("http://www.baidu.com/").read().decode()
#分析网页,确定正则表达式
pat=r'(.*?)'
result=re.search(pat,data)
print(result)
result.group() # 百度一下,你就知道
```
#### 16 批量转化为驼峰格式(Camel)
数据库字段名批量转化为驼峰格式
分析过程
```python
# 用到的正则串讲解
# \s 指匹配: [ \t\n\r\f\v]
# A|B:表示匹配A串或B串
# re.sub(pattern, newchar, string):
# substitue代替,用newchar字符替代与pattern匹配的字符所有.
```
```python
# title(): 转化为大写,例子:
# 'Hello world'.title() # 'Hello World'
```
```python
# print(re.sub(r"\s|_|", "", "He llo_worl\td"))
s = re.sub(r"(\s|_|-)+", " ",
'some_database_field_name').title().replace(" ", "")
#结果: SomeDatabaseFieldName
```
```python
# 可以看到此时的第一个字符为大写,需要转化为小写
s = s[0].lower()+s[1:] # 最终结果
```
整理以上分析得到如下代码:
```python
import re
def camel(s):
s = re.sub(r"(\s|_|-)+", " ", s).title().replace(" ", "")
return s[0].lower() + s[1:]
# 批量转化
def batch_camel(slist):
return [camel(s) for s in slist]
```
测试结果:
```python
s = batch_camel(['student_id', 'student\tname', 'student-add'])
print(s)
# 结果
['studentId', 'studentName', 'studentAdd']
```
### 四、Python文件
#### 1 获取后缀名
```python
import os
file_ext = os.path.splitext('./data/py/test.py')
front,ext = file_ext
In [5]: front
Out[5]: './data/py/test'
In [6]: ext
Out[6]: '.py'
```
#### 2 文件读操作
```python
import os
# 创建文件夹
def mkdir(path):
isexists = os.path.exists(path)
if not isexists:
os.mkdir(path)
# 读取文件信息
def openfile(filename):
f = open(filename)
fllist = f.read()
f.close()
return fllist # 返回读取内容
```
#### 3 文件写操作
```python
# 写入文件信息
# example1
# w写入,如果文件存在,则清空内容后写入,不存在则创建
f = open(r"./data/test.txt", "w", encoding="utf-8")
print(f.write("测试文件写入"))
f.close
# example2
# a写入,文件存在,则在文件内容后追加写入,不存在则创建
f = open(r"./data/test.txt", "a", encoding="utf-8")
print(f.write("测试文件写入"))
f.close
# example3
# with关键字系统会自动关闭文件和处理异常
with open(r"./data/test.txt", "w") as f:
f.write("hello world!")
```
#### 4 路径中的文件名
```python
In [11]: import os
...: file_ext = os.path.split('./data/py/test.py')
...: ipath,ifile = file_ext
...:
In [12]: ipath
Out[12]: './data/py'
In [13]: ifile
Out[13]: 'test.py'
```
#### 5 批量修改文件后缀
**批量修改文件后缀**
本例子使用Python的`os`模块和 `argparse`模块,将工作目录`work_dir`下所有后缀名为`old_ext`的文件修改为后缀名为`new_ext`
通过本例子,大家将会大概清楚`argparse`模块的主要用法。
导入模块
```python
import argparse
import os
```
定义脚本参数
```python
def get_parser():
parser = argparse.ArgumentParser(
description='工作目录中文件后缀名修改')
parser.add_argument('work_dir', metavar='WORK_DIR', type=str, nargs=1,
help='修改后缀名的文件目录')
parser.add_argument('old_ext', metavar='OLD_EXT',
type=str, nargs=1, help='原来的后缀')
parser.add_argument('new_ext', metavar='NEW_EXT',
type=str, nargs=1, help='新的后缀')
return parser
```
后缀名批量修改
```python
def batch_rename(work_dir, old_ext, new_ext):
"""
传递当前目录,原来后缀名,新的后缀名后,批量重命名后缀
"""
for filename in os.listdir(work_dir):
# 获取得到文件后缀
split_file = os.path.splitext(filename)
file_ext = split_file[1]
# 定位后缀名为old_ext 的文件
if old_ext == file_ext:
# 修改后文件的完整名称
newfile = split_file[0] + new_ext
# 实现重命名操作
os.rename(
os.path.join(work_dir, filename),
os.path.join(work_dir, newfile)
)
print("完成重命名")
print(os.listdir(work_dir))
```
实现Main
```python
def main():
"""
main函数
"""
# 命令行参数
parser = get_parser()
args = vars(parser.parse_args())
# 从命令行参数中依次解析出参数
work_dir = args['work_dir'][0]
old_ext = args['old_ext'][0]
if old_ext[0] != '.':
old_ext = '.' + old_ext
new_ext = args['new_ext'][0]
if new_ext[0] != '.':
new_ext = '.' + new_ext
batch_rename(work_dir, old_ext, new_ext)
```
#### 6 xls批量转换成xlsx
```python
import os
def xls_to_xlsx(work_dir):
"""
传递当前目录,原来后缀名,新的后缀名后,批量重命名后缀
"""
old_ext, new_ext = '.xls', '.xlsx'
for filename in os.listdir(work_dir):
# 获取得到文件后缀
split_file = os.path.splitext(filename)
file_ext = split_file[1]
# 定位后缀名为old_ext 的文件
if old_ext == file_ext:
# 修改后文件的完整名称
newfile = split_file[0] + new_ext
# 实现重命名操作
os.rename(
os.path.join(work_dir, filename),
os.path.join(work_dir, newfile)
)
print("完成重命名")
print(os.listdir(work_dir))
xls_to_xlsx('./data')
# 输出结果:
# ['cut_words.csv', 'email_list.xlsx', 'email_test.docx', 'email_test.jpg', 'email_test.xlsx', 'geo_data.png', 'geo_data.xlsx',
'iotest.txt', 'pyside2.md', 'PySimpleGUI-4.7.1-py3-none-any.whl', 'test.txt', 'test_excel.xlsx', 'ziptest', 'ziptest.zip']
```
#### 7 定制文件不同行
比较两个文件在哪些行内容不同,返回这些行的编号,行号编号从1开始。
定义统计文件行数的函数
```python
# 统计文件个数
def statLineCnt(statfile):
print('文件名:'+statfile)
cnt = 0
with open(statfile, encoding='utf-8') as f:
while f.readline():
cnt += 1
return cnt
```
统计文件不同之处的子函数:
```python
# more表示含有更多行数的文件
def diff(more, cnt, less):
difflist = []
with open(less, encoding='utf-8') as l:
with open(more, encoding='utf-8') as m:
lines = l.readlines()
for i, line in enumerate(lines):
if line.strip() != m.readline().strip():
difflist.append(i)
if cnt - i > 1:
difflist.extend(range(i + 1, cnt))
return [no+1 for no in difflist]
```
主函数:
```python
# 返回的结果行号从1开始
# list表示fileA和fileB不同的行的编号
def file_diff_line_nos(fileA, fileB):
try:
cntA = statLineCnt(fileA)
cntB = statLineCnt(fileB)
if cntA > cntB:
return diff(fileA, cntA, fileB)
return diff(fileB, cntB, fileA)
except Exception as e:
print(e)
```
比较两个文件A和B,拿相对较短的文件去比较,过滤行后的换行符`\n`和空格。
暂未考虑某个文件最后可能有的多行空行等特殊情况
使用`file_diff_line_nos` 函数:
```python
if __name__ == '__main__':
import os
print(os.getcwd())
'''
例子:
fileA = "'hello world!!!!''\
'nice to meet you'\
'yes'\
'no1'\
'jack'"
fileB = "'hello world!!!!''\
'nice to meet you'\
'yes' "
'''
diff = file_diff_line_nos('./testdir/a.txt', './testdir/b.txt')
print(diff) # [4, 5]
```
关于文件比较的,实际上,在Python中有对应模块`difflib` , 提供更多其他格式的文件更详细的比较,大家可参考:
> https://docs.python.org/3/library/difflib.html?highlight=difflib#module-difflib
#### 8 获取指定后缀名的文件
```python
import os
def find_file(work_dir,extension='jpg'):
lst = []
for filename in os.listdir(work_dir):
print(filename)
splits = os.path.splitext(filename)
ext = splits[1] # 拿到扩展名
if ext == '.'+extension:
lst.append(filename)
return lst
r = find_file('.','md')
print(r) # 返回所有目录下的md文件
```
#### 9 批量获取文件修改时间
```python
# 获取目录下文件的修改时间
import os
from datetime import datetime
print(f"当前时间:{datetime.now().strftime('%Y-%m-%d %H:%M:%S')}")
def get_modify_time(indir):
for root, _, files in os.walk(indir): # 循环D:\works目录和子目录
for file in files:
absfile = os.path.join(root, file)
modtime = datetime.fromtimestamp(os.path.getmtime(absfile))
now = datetime.now()
difftime = now-modtime
if difftime.days < 20: # 条件筛选超过指定时间的文件
print(f"""{absfile}
修改时间[{modtime.strftime('%Y-%m-%d %H:%M:%S')}]
距今[{difftime.days:3d}天{difftime.seconds//3600:2d}时{difftime.seconds%3600//60:2d}]"""
) # 打印相关信息
get_modify_time('./data')
```
打印效果:
当前时间:2019-12-22 16:38:53
./data\cut_words.csv
修改时间[2019-12-21 10:34:15]
距今[ 1天 6时 4]
当前时间:2019-12-22 16:38:53
./data\cut_words.csv
修改时间[2019-12-21 10:34:15]
距今[ 1天 6时 4]
./data\email_test.docx
修改时间[2019-12-03 07:46:29]
距今[ 19天 8时52]
./data\email_test.jpg
修改时间[2019-12-03 07:46:29]
距今[ 19天 8时52]
./data\email_test.xlsx
修改时间[2019-12-03 07:46:29]
距今[ 19天 8时52]
./data\iotest.txt
修改时间[2019-12-13 08:23:18]
距今[ 9天 8时15]
./data\pyside2.md
修改时间[2019-12-05 08:17:22]
距今[ 17天 8时21]
./data\PySimpleGUI-4.7.1-py3-none-any.whl
修改时间[2019-12-05 00:25:47]
距今[ 17天16时13]
#### 10 批量压缩文件
```python
import zipfile # 导入zipfile,这个是用来做压缩和解压的Python模块;
import os
import time
def batch_zip(start_dir):
start_dir = start_dir # 要压缩的文件夹路径
file_news = start_dir + '.zip' # 压缩后文件夹的名字
z = zipfile.ZipFile(file_news, 'w', zipfile.ZIP_DEFLATED)
for dir_path, dir_names, file_names in os.walk(start_dir):
# 这一句很重要,不replace的话,就从根目录开始复制
f_path = dir_path.replace(start_dir, '')
f_path = f_path and f_path + os.sep # 实现当前文件夹以及包含的所有文件的压缩
for filename in file_names:
z.write(os.path.join(dir_path, filename), f_path + filename)
z.close()
return file_news
batch_zip('./data/ziptest')
```
#### 11 32位加密
```python
import hashlib
# 对字符串s实现32位加密
def hash_cry32(s):
m = hashlib.md5()
m.update((str(s).encode('utf-8')))
return m.hexdigest()
print(hash_cry32(1)) # c4ca4238a0b923820dcc509a6f75849b
print(hash_cry32('hello')) # 5d41402abc4b2a76b9719d911017c592
```
### 五、Python日期
Python日期章节,由表示大日期的`calendar`, `date`模块,逐渐过渡到表示时间刻度更小的模块:`datetime`, `time`模块,按照此逻辑展开,总结了最常用的`9`个关于时间处理模块的例子。
#### 1 年的日历图
```python
import calendar
year_calendar_str = calendar.calendar(2019)
print(f"{mydate.year}年的日历图:{year_calendar_str}\n")
```
打印结果:
```python
2019
January February March
Mo Tu We Th Fr Sa Su Mo Tu We Th Fr Sa Su Mo Tu We Th Fr Sa Su
1 2 3 4 5 6 1 2 3 1 2 3
7 8 9 10 11 12 13 4 5 6 7 8 9 10 4 5 6 7 8 9 10
14 15 16 17 18 19 20 11 12 13 14 15 16 17 11 12 13 14 15 16 17
21 22 23 24 25 26 27 18 19 20 21 22 23 24 18 19 20 21 22 23 24
28 29 30 31 25 26 27 28 25 26 27 28 29 30 31
April May June
Mo Tu We Th Fr Sa Su Mo Tu We Th Fr Sa Su Mo Tu We Th Fr Sa Su
1 2 3 4 5 6 7 1 2 3 4 5 1 2
8 9 10 11 12 13 14 6 7 8 9 10 11 12 3 4 5 6 7 8 9
15 16 17 18 19 20 21 13 14 15 16 17 18 19 10 11 12 13 14 15 16
22 23 24 25 26 27 28 20 21 22 23 24 25 26 17 18 19 20 21 22 23
29 30 27 28 29 30 31 24 25 26 27 28 29 30
July August September
Mo Tu We Th Fr Sa Su Mo Tu We Th Fr Sa Su Mo Tu We Th Fr Sa Su
1 2 3 4 5 6 7 1 2 3 4 1
8 9 10 11 12 13 14 5 6 7 8 9 10 11 2 3 4 5 6 7 8
15 16 17 18 19 20 21 12 13 14 15 16 17 18 9 10 11 12 13 14 15
22 23 24 25 26 27 28 19 20 21 22 23 24 25 16 17 18 19 20 21 22
29 30 31 26 27 28 29 30 31 23 24 25 26 27 28 29
30
October November December
Mo Tu We Th Fr Sa Su Mo Tu We Th Fr Sa Su Mo Tu We Th Fr Sa Su
1 2 3 4 5 6 1 2 3 1
7 8 9 10 11 12 13 4 5 6 7 8 9 10 2 3 4 5 6 7 8
14 15 16 17 18 19 20 11 12 13 14 15 16 17 9 10 11 12 13 14 15
21 22 23 24 25 26 27 18 19 20 21 22 23 24 16 17 18 19 20 21 22
28 29 30 31 25 26 27 28 29 30 23 24 25 26 27 28 29
30 31
```
#### 2 判断是否为闰年
```python
import calendar
is_leap = calendar.isleap(mydate.year)
print_leap_str = "%s年是闰年" if is_leap else "%s年不是闰年\n"
print(print_leap_str % mydate.year)
```
打印结果:
```python
2019年不是闰年
```
#### 3 月的日历图
```python
import calendar
month_calendar_str = calendar.month(mydate.year, mydate.month)
print(f"{mydate.year}年-{mydate.month}月的日历图:{month_calendar_str}\n")
```
打印结果:
```python
December 2019
Mo Tu We Th Fr Sa Su
1
2 3 4 5 6 7 8
9 10 11 12 13 14 15
16 17 18 19 20 21 22
23 24 25 26 27 28 29
30 31
```
#### 4 月有几天
```python
import calendar
weekday, days = calendar.monthrange(mydate.year, mydate.month)
print(f'{mydate.year}年-{mydate.month}月的第一天是那一周的第{weekday}天\n')
print(f'{mydate.year}年-{mydate.month}月共有{days}天\n')
```
打印结果:
```python
2019年-12月的第一天是那一周的第6天
2019年-12月共有31天
```
#### 5 月第一天
```python
from datetime import date
month_first_day = date(mydate.year, mydate.month, 1)
print(f"当月第一天:{month_first_day}\n")
```
打印结果:
```python
当月第一天:2019-12-01
```
#### 6 月最后一天
```python
from datetime import date
import calendar
_, days = calendar.monthrange(mydate.year, mydate.month)
month_last_day = date(mydate.year, mydate.month, days)
print(f"当月最后一天:{month_last_day}\n")
```
打印结果:
```python
当月最后一天:2019-12-31
```
#### 7 获取当前时间
```python
from datetime import date, datetime
from time import localtime
today_date = date.today()
print(today_date) # 2019-12-22
today_time = datetime.today()
print(today_time) # 2019-12-22 18:02:33.398894
local_time = localtime()
print(strftime("%Y-%m-%d %H:%M:%S", local_time)) # 转化为定制的格式 2019-12-22 18:13:41
```
#### 8 字符时间转时间
```python
from time import strptime
# parse str time to struct time
struct_time = strptime('2019-12-22 10:10:08', "%Y-%m-%d %H:%M:%S")
print(struct_time) # struct_time类型就是time中的一个类
# time.struct_time(tm_year=2019, tm_mon=12, tm_mday=22, tm_hour=10, tm_min=10, tm_sec=8, tm_wday=6, tm_yday=356, tm_isdst=-1)
```
#### 9 时间转字符时间
```python
from time import strftime, strptime, localtime
In [2]: print(localtime()) #这是输入的时间
Out[2]: time.struct_time(tm_year=2019, tm_mon=12, tm_mday=22, tm_hour=18, tm_min=24, tm_sec=56, tm_wday=6, tm_yday=356, tm_isdst=0)
print(strftime("%m-%d-%Y %H:%M:%S", localtime())) # 转化为定制的格式
# 这是字符串表示的时间: 12-22-2019 18:26:21
```
### 六、Python利器
Python中的三大利器包括:`迭代器`,`生成器`,`装饰器`,利用好它们才能开发出最高性能的Python程序,涉及到的内置模块 `itertools`提供迭代器相关的操作。此部分收录有意思的例子共计`14`例。
#### 1 寻找第n次出现位置
```python
def search_n(s, c, n):
size = 0
for i, x in enumerate(s):
if x == c:
size += 1
if size == n:
return i
return -1
print(search_n("fdasadfadf", "a", 3))# 结果为7,正确
print(search_n("fdasadfadf", "a", 30))# 结果为-1,正确
```
#### 2 斐波那契数列前n项
```python
def fibonacci(n):
a, b = 1, 1
for _ in range(n):
yield a
a, b = b, a + b
list(fibonacci(5)) # [1, 1, 2, 3, 5]
```
#### 3 找出所有重复元素
```python
from collections import Counter
def find_all_duplicates(lst):
c = Counter(lst)
return list(filter(lambda k: c[k] > 1, c))
find_all_duplicates([1, 2, 2, 3, 3, 3]) # [2,3]
```
#### 4 联合统计次数
Counter对象间可以做数学运算
```python
from collections import Counter
a = ['apple', 'orange', 'computer', 'orange']
b = ['computer', 'orange']
ca = Counter(a)
cb = Counter(b)
#Counter对象间可以做数学运算
ca + cb # Counter({'orange': 3, 'computer': 2, 'apple': 1})
# 进一步抽象,实现多个列表内元素的个数统计
def sumc(*c):
if (len(c) < 1):
return
mapc = map(Counter, c)
s = Counter([])
for ic in mapc: # ic 是一个Counter对象
s += ic
return s
#Counter({'orange': 3, 'computer': 3, 'apple': 1, 'abc': 1, 'face': 1})
sumc(a, b, ['abc'], ['face', 'computer'])
```
#### 5 groupby单字段分组
天气记录:
```python
a = [{'date': '2019-12-15', 'weather': 'cloud'},
{'date': '2019-12-13', 'weather': 'sunny'},
{'date': '2019-12-14', 'weather': 'cloud'}]
```
按照天气字段`weather`分组汇总:
```python
from itertools import groupby
for k, items in groupby(a,key=lambda x:x['weather']):
print(k)
```
输出结果看出,分组失败!原因:分组前必须按照分组字段`排序`,这个很坑~
```python
cloud
sunny
cloud
```
修改代码:
```python
a.sort(key=lambda x: x['weather'])
for k, items in groupby(a,key=lambda x:x['weather']):
print(k)
for i in items:
print(i)
```
输出结果:
```python
cloud
{'date': '2019-12-15', 'weather': 'cloud'}
{'date': '2019-12-14', 'weather': 'cloud'}
sunny
{'date': '2019-12-13', 'weather': 'sunny'}
```
#### 6 itemgetter和key函数
注意到`sort`和`groupby`所用的`key`函数,除了`lambda`写法外,还有一种简写,就是使用`itemgetter`:
```python
a = [{'date': '2019-12-15', 'weather': 'cloud'},
{'date': '2019-12-13', 'weather': 'sunny'},
{'date': '2019-12-14', 'weather': 'cloud'}]
from operator import itemgetter
from itertools import groupby
a.sort(key=itemgetter('weather'))
for k, items in groupby(a, key=itemgetter('weather')):
print(k)
for i in items:
print(i)
```
结果:
```python
cloud
{'date': '2019-12-15', 'weather': 'cloud'}
{'date': '2019-12-14', 'weather': 'cloud'}
sunny
{'date': '2019-12-13', 'weather': 'sunny'}
```
#### 7 groupby多字段分组
`itemgetter`是一个类,`itemgetter('weather')`返回一个可调用的对象,它的参数可有多个:
```python
from operator import itemgetter
from itertools import groupby
a.sort(key=itemgetter('weather', 'date'))
for k, items in groupby(a, key=itemgetter('weather')):
print(k)
for i in items:
print(i)
```
结果如下,使用`weather`和`date`两个字段排序`a`,
```python
cloud
{'date': '2019-12-14', 'weather': 'cloud'}
{'date': '2019-12-15', 'weather': 'cloud'}
sunny
{'date': '2019-12-13', 'weather': 'sunny'}
```
注意这个结果与上面结果有些微妙不同,这个更多是我们想看到和使用更多的。
#### 8 sum函数计算和聚合同时做
Python中的聚合类函数`sum`,`min`,`max`第一个参数是`iterable`类型,一般使用方法如下:
```python
a = [4,2,5,1]
sum([i+1 for i in a]) # 16
```
使用列表生成式`[i+1 for i in a]`创建一个长度与`a`一行的临时列表,这步完成后,再做`sum`聚合。
试想如果你的数组`a`长度十百万级,再创建一个这样的临时列表就很不划算,最好是一边算一边聚合,稍改动为如下:
```python
a = [4,2,5,1]
sum(i+1 for i in a) # 16
```
此时`i+1 for i in a`是`(i+1 for i in a)`的简写,得到一个生成器(`generator`)对象,如下所示:
```python
In [8]:(i+1 for i in a)
OUT [8]: at 0x000002AC7FFA8CF0>
```
生成器每迭代一步吐出(`yield`)一个元素并计算和聚合后,进入下一次迭代,直到终点。
#### 9 list分组(生成器版)
```python
from math import ceil
def divide_iter(lst, n):
if n <= 0:
yield lst
return
i, div = 0, ceil(len(lst) / n)
while i < n:
yield lst[i * div: (i + 1) * div]
i += 1
list(divide_iter([1, 2, 3, 4, 5], 0)) # [[1, 2, 3, 4, 5]]
list(divide_iter([1, 2, 3, 4, 5], 2)) # [[1, 2, 3], [4, 5]]
```
#### 10 列表全展开(生成器版)
```python
#多层列表展开成单层列表
a=[1,2,[3,4,[5,6],7],8,["python",6],9]
def function(lst):
for i in lst:
if type(i)==list:
yield from function(i)
else:
yield i
print(list(function(a))) # [1, 2, 3, 4, 5, 6, 7, 8, 'python', 6, 9]
```
#### 11 测试函数运行时间的装饰器
```python
#测试函数执行时间的装饰器示例
import time
def timing_func(fn):
def wrapper():
start=time.time()
fn() #执行传入的fn参数
stop=time.time()
return (stop-start)
return wrapper
@timing_func
def test_list_append():
lst=[]
for i in range(0,100000):
lst.append(i)
@timing_func
def test_list_compre():
[i for i in range(0,100000)] #列表生成式
a=test_list_append()
c=test_list_compre()
print("test list append time:",a)
print("test list comprehension time:",c)
print("append/compre:",round(a/c,3))
test list append time: 0.0219423770904541
test list comprehension time: 0.007980823516845703
append/compre: 2.749
```
#### 12 统计异常出现次数和时间的装饰器
写一个装饰器,统计某个异常重复出现指定次数时,经历的时长。
```python
import time
import math
def excepter(f):
i = 0
t1 = time.time()
def wrapper():
try:
f()
except Exception as e:
nonlocal i
i += 1
print(f'{e.args[0]}: {i}')
t2 = time.time()
if i == n:
print(f'spending time:{round(t2-t1,2)}')
return wrapper
```
关键词`nonlocal`常用于函数嵌套中,声明变量i为非局部变量;
如果不声明,`i+=1`表明`i`为函数`wrapper`内的局部变量,因为在`i+=1`引用(reference)时,`i`未被声明,所以会报`unreferenced variable`的错误。
使用创建的装饰函数`excepter`, `n`是异常出现的次数。
共测试了两类常见的异常:`被零除`和`数组越界`。
```python
n = 10 # except count
@excepter
def divide_zero_except():
time.sleep(0.1)
j = 1/(40-20*2)
# test zero divived except
for _ in range(n):
divide_zero_except()
@excepter
def outof_range_except():
a = [1,3,5]
time.sleep(0.1)
print(a[3])
# test out of range except
for _ in range(n):
outof_range_except()
```
打印出来的结果如下:
```python
division by zero: 1
division by zero: 2
division by zero: 3
division by zero: 4
division by zero: 5
division by zero: 6
division by zero: 7
division by zero: 8
division by zero: 9
division by zero: 10
spending time:1.01
list index out of range: 1
list index out of range: 2
list index out of range: 3
list index out of range: 4
list index out of range: 5
list index out of range: 6
list index out of range: 7
list index out of range: 8
list index out of range: 9
list index out of range: 10
spending time:1.01
```
#### 13 定制递减迭代器
```python
#编写一个迭代器,通过循环语句,实现对某个正整数的依次递减1,直到0.
class Descend(Iterator):
def __init__(self,N):
self.N=N
self.a=0
def __iter__(self):
return self
def __next__(self):
while self.a
#### 3 wordcloud词云图
```python
import hashlib
import pandas as pd
from wordcloud import WordCloud
geo_data=pd.read_excel(r"../data/geo_data.xlsx")
print(geo_data)
# 0 深圳
# 1 深圳
# 2 深圳
# 3 深圳
# 4 深圳
# 5 深圳
# 6 深圳
# 7 广州
# 8 广州
# 9 广州
words = ','.join(x for x in geo_data['city'] if x != []) #筛选出非空列表值
wc = WordCloud(
background_color="green", #背景颜色"green"绿色
max_words=100, #显示最大词数
font_path='./fonts/simhei.ttf', #显示中文
min_font_size=5,
max_font_size=100,
width=500 #图幅宽度
)
x = wc.generate(words)
x.to_file('../data/geo_data.png')
```

#### 4 plotly画柱状图和折线图
```python
#柱状图+折线图
import plotly.graph_objects as go
fig = go.Figure()
fig.add_trace(
go.Scatter(
x=[0, 1, 2, 3, 4, 5],
y=[1.5, 1, 1.3, 0.7, 0.8, 0.9]
))
fig.add_trace(
go.Bar(
x=[0, 1, 2, 3, 4, 5],
y=[2, 0.5, 0.7, -1.2, 0.3, 0.4]
))
fig.show()
```
 #### 5 seaborn热力图
```python
# 导入库
import seaborn as sns
import pandas as pd
import numpy as np
import matplotlib.pyplot as plt
# 生成数据集
data = np.random.random((6,6))
np.fill_diagonal(data,np.ones(6))
features = ["prop1","prop2","prop3","prop4","prop5", "prop6"]
data = pd.DataFrame(data, index = features, columns=features)
print(data)
# 绘制热力图
heatmap_plot = sns.heatmap(data, center=0, cmap='gist_rainbow')
plt.show()
```
#### 5 seaborn热力图
```python
# 导入库
import seaborn as sns
import pandas as pd
import numpy as np
import matplotlib.pyplot as plt
# 生成数据集
data = np.random.random((6,6))
np.fill_diagonal(data,np.ones(6))
features = ["prop1","prop2","prop3","prop4","prop5", "prop6"]
data = pd.DataFrame(data, index = features, columns=features)
print(data)
# 绘制热力图
heatmap_plot = sns.heatmap(data, center=0, cmap='gist_rainbow')
plt.show()
```
 #### 6 matplotlib折线图
模块名称:example_utils.py,里面包括三个函数,各自功能如下:
```python
import matplotlib.pyplot as plt
# 创建画图fig和axes
def setup_axes():
fig, axes = plt.subplots(ncols=3, figsize=(6.5,3))
for ax in fig.axes:
ax.set(xticks=[], yticks=[])
fig.subplots_adjust(wspace=0, left=0, right=0.93)
return fig, axes
# 图片标题
def title(fig, text, y=0.9):
fig.suptitle(text, size=14, y=y, weight='semibold', x=0.98, ha='right',
bbox=dict(boxstyle='round', fc='floralwhite', ec='#8B7E66',
lw=2))
# 为数据添加文本注释
def label(ax, text, y=0):
ax.annotate(text, xy=(0.5, 0.00), xycoords='axes fraction', ha='center',
style='italic',
bbox=dict(boxstyle='round', facecolor='floralwhite',
ec='#8B7E66'))
```
#### 6 matplotlib折线图
模块名称:example_utils.py,里面包括三个函数,各自功能如下:
```python
import matplotlib.pyplot as plt
# 创建画图fig和axes
def setup_axes():
fig, axes = plt.subplots(ncols=3, figsize=(6.5,3))
for ax in fig.axes:
ax.set(xticks=[], yticks=[])
fig.subplots_adjust(wspace=0, left=0, right=0.93)
return fig, axes
# 图片标题
def title(fig, text, y=0.9):
fig.suptitle(text, size=14, y=y, weight='semibold', x=0.98, ha='right',
bbox=dict(boxstyle='round', fc='floralwhite', ec='#8B7E66',
lw=2))
# 为数据添加文本注释
def label(ax, text, y=0):
ax.annotate(text, xy=(0.5, 0.00), xycoords='axes fraction', ha='center',
style='italic',
bbox=dict(boxstyle='round', facecolor='floralwhite',
ec='#8B7E66'))
```
 ```python
import numpy as np
import matplotlib.pyplot as plt
import example_utils
x = np.linspace(0, 10, 100)
fig, axes = example_utils.setup_axes()
for ax in axes:
ax.margins(y=0.10)
# 子图1 默认plot多条线,颜色系统分配
for i in range(1, 6):
axes[0].plot(x, i * x)
# 子图2 展示线的不同linestyle
for i, ls in enumerate(['-', '--', ':', '-.']):
axes[1].plot(x, np.cos(x) + i, linestyle=ls)
# 子图3 展示线的不同linestyle和marker
for i, (ls, mk) in enumerate(zip(['', '-', ':'], ['o', '^', 's'])):
axes[2].plot(x, np.cos(x) + i * x, linestyle=ls, marker=mk, markevery=10)
# 设置标题
# example_utils.title(fig, '"ax.plot(x, y, ...)": Lines and/or markers', y=0.95)
# 保存图片
fig.savefig('plot_example.png', facecolor='none')
# 展示图片
plt.show()
```
#### 7 matplotlib散点图
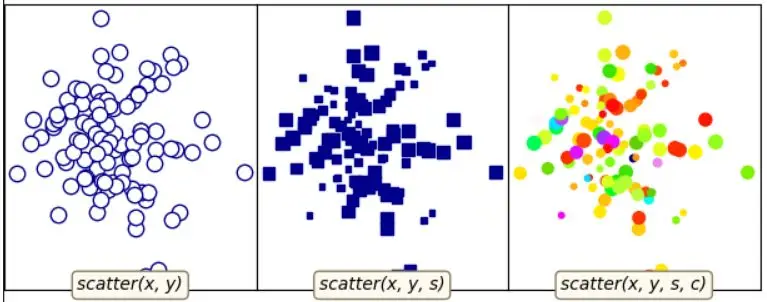
对应代码:
```python
"""
散点图的基本用法
"""
import numpy as np
import matplotlib.pyplot as plt
import example_utils
# 随机生成数据
np.random.seed(1874)
x, y, z = np.random.normal(0, 1, (3, 100))
t = np.arctan2(y, x)
size = 50 * np.cos(2 * t)**2 + 10
fig, axes = example_utils.setup_axes()
# 子图1
axes[0].scatter(x, y, marker='o', color='darkblue', facecolor='white', s=80)
example_utils.label(axes[0], 'scatter(x, y)')
# 子图2
axes[1].scatter(x, y, marker='s', color='darkblue', s=size)
example_utils.label(axes[1], 'scatter(x, y, s)')
# 子图3
axes[2].scatter(x, y, s=size, c=z, cmap='gist_ncar')
example_utils.label(axes[2], 'scatter(x, y, s, c)')
# example_utils.title(fig, '"ax.scatter(...)": Colored/scaled markers',
# y=0.95)
fig.savefig('scatter_example.png', facecolor='none')
plt.show()
```
#### 8 matplotlib柱状图
```python
import numpy as np
import matplotlib.pyplot as plt
import example_utils
x = np.linspace(0, 10, 100)
fig, axes = example_utils.setup_axes()
for ax in axes:
ax.margins(y=0.10)
# 子图1 默认plot多条线,颜色系统分配
for i in range(1, 6):
axes[0].plot(x, i * x)
# 子图2 展示线的不同linestyle
for i, ls in enumerate(['-', '--', ':', '-.']):
axes[1].plot(x, np.cos(x) + i, linestyle=ls)
# 子图3 展示线的不同linestyle和marker
for i, (ls, mk) in enumerate(zip(['', '-', ':'], ['o', '^', 's'])):
axes[2].plot(x, np.cos(x) + i * x, linestyle=ls, marker=mk, markevery=10)
# 设置标题
# example_utils.title(fig, '"ax.plot(x, y, ...)": Lines and/or markers', y=0.95)
# 保存图片
fig.savefig('plot_example.png', facecolor='none')
# 展示图片
plt.show()
```
#### 7 matplotlib散点图

对应代码:
```python
"""
散点图的基本用法
"""
import numpy as np
import matplotlib.pyplot as plt
import example_utils
# 随机生成数据
np.random.seed(1874)
x, y, z = np.random.normal(0, 1, (3, 100))
t = np.arctan2(y, x)
size = 50 * np.cos(2 * t)**2 + 10
fig, axes = example_utils.setup_axes()
# 子图1
axes[0].scatter(x, y, marker='o', color='darkblue', facecolor='white', s=80)
example_utils.label(axes[0], 'scatter(x, y)')
# 子图2
axes[1].scatter(x, y, marker='s', color='darkblue', s=size)
example_utils.label(axes[1], 'scatter(x, y, s)')
# 子图3
axes[2].scatter(x, y, s=size, c=z, cmap='gist_ncar')
example_utils.label(axes[2], 'scatter(x, y, s, c)')
# example_utils.title(fig, '"ax.scatter(...)": Colored/scaled markers',
# y=0.95)
fig.savefig('scatter_example.png', facecolor='none')
plt.show()
```
#### 8 matplotlib柱状图
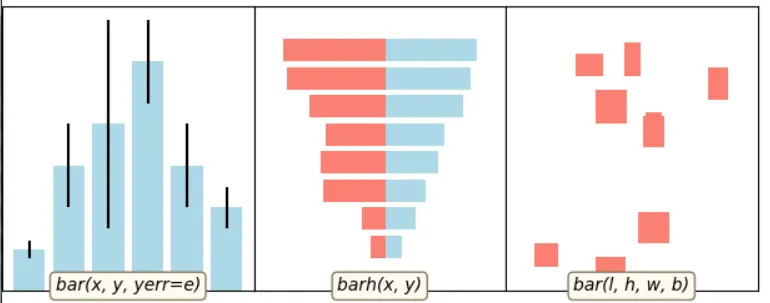 对应代码:
```python
import numpy as np
import matplotlib.pyplot as plt
import example_utils
def main():
fig, axes = example_utils.setup_axes()
basic_bar(axes[0])
tornado(axes[1])
general(axes[2])
# example_utils.title(fig, '"ax.bar(...)": Plot rectangles')
fig.savefig('bar_example.png', facecolor='none')
plt.show()
# 子图1
def basic_bar(ax):
y = [1, 3, 4, 5.5, 3, 2]
err = [0.2, 1, 2.5, 1, 1, 0.5]
x = np.arange(len(y))
ax.bar(x, y, yerr=err, color='lightblue', ecolor='black')
ax.margins(0.05)
ax.set_ylim(bottom=0)
example_utils.label(ax, 'bar(x, y, yerr=e)')
# 子图2
def tornado(ax):
y = np.arange(8)
x1 = y + np.random.random(8) + 1
x2 = y + 3 * np.random.random(8) + 1
ax.barh(y, x1, color='lightblue')
ax.barh(y, -x2, color='salmon')
ax.margins(0.15)
example_utils.label(ax, 'barh(x, y)')
# 子图3
def general(ax):
num = 10
left = np.random.randint(0, 10, num)
bottom = np.random.randint(0, 10, num)
width = np.random.random(num) + 0.5
height = np.random.random(num) + 0.5
ax.bar(left, height, width, bottom, color='salmon')
ax.margins(0.15)
example_utils.label(ax, 'bar(l, h, w, b)')
main()
```
#### 9 matplotlib等高线图
对应代码:
```python
import numpy as np
import matplotlib.pyplot as plt
import example_utils
def main():
fig, axes = example_utils.setup_axes()
basic_bar(axes[0])
tornado(axes[1])
general(axes[2])
# example_utils.title(fig, '"ax.bar(...)": Plot rectangles')
fig.savefig('bar_example.png', facecolor='none')
plt.show()
# 子图1
def basic_bar(ax):
y = [1, 3, 4, 5.5, 3, 2]
err = [0.2, 1, 2.5, 1, 1, 0.5]
x = np.arange(len(y))
ax.bar(x, y, yerr=err, color='lightblue', ecolor='black')
ax.margins(0.05)
ax.set_ylim(bottom=0)
example_utils.label(ax, 'bar(x, y, yerr=e)')
# 子图2
def tornado(ax):
y = np.arange(8)
x1 = y + np.random.random(8) + 1
x2 = y + 3 * np.random.random(8) + 1
ax.barh(y, x1, color='lightblue')
ax.barh(y, -x2, color='salmon')
ax.margins(0.15)
example_utils.label(ax, 'barh(x, y)')
# 子图3
def general(ax):
num = 10
left = np.random.randint(0, 10, num)
bottom = np.random.randint(0, 10, num)
width = np.random.random(num) + 0.5
height = np.random.random(num) + 0.5
ax.bar(left, height, width, bottom, color='salmon')
ax.margins(0.15)
example_utils.label(ax, 'bar(l, h, w, b)')
main()
```
#### 9 matplotlib等高线图
 对应代码:
```python
import matplotlib.pyplot as plt
import numpy as np
from matplotlib.cbook import get_sample_data
import example_utils
z = np.load(get_sample_data('bivariate_normal.npy'))
fig, axes = example_utils.setup_axes()
axes[0].contour(z, cmap='gist_earth')
example_utils.label(axes[0], 'contour')
axes[1].contourf(z, cmap='gist_earth')
example_utils.label(axes[1], 'contourf')
axes[2].contourf(z, cmap='gist_earth')
cont = axes[2].contour(z, colors='black')
axes[2].clabel(cont, fontsize=6)
example_utils.label(axes[2], 'contourf + contour\n + clabel')
# example_utils.title(fig, '"contour, contourf, clabel": Contour/label 2D data',
# y=0.96)
fig.savefig('contour_example.png', facecolor='none')
plt.show()
```
#### 10 imshow图

对应代码:
```python
import matplotlib.pyplot as plt
import numpy as np
from matplotlib.cbook import get_sample_data
from mpl_toolkits import axes_grid1
import example_utils
def main():
fig, axes = setup_axes()
plot(axes, *load_data())
# example_utils.title(fig, '"ax.imshow(data, ...)": Colormapped or RGB arrays')
fig.savefig('imshow_example.png', facecolor='none')
plt.show()
def plot(axes, img_data, scalar_data, ny):
# 默认线性插值
axes[0].imshow(scalar_data, cmap='gist_earth', extent=[0, ny, ny, 0])
# 最近邻插值
axes[1].imshow(scalar_data, cmap='gist_earth', interpolation='nearest',
extent=[0, ny, ny, 0])
# 展示RGB/RGBA数据
axes[2].imshow(img_data)
def load_data():
img_data = plt.imread(get_sample_data('5.png'))
ny, nx, nbands = img_data.shape
scalar_data = np.load(get_sample_data('bivariate_normal.npy'))
return img_data, scalar_data, ny
def setup_axes():
fig = plt.figure(figsize=(6, 3))
axes = axes_grid1.ImageGrid(fig, [0, 0, .93, 1], (1, 3), axes_pad=0)
for ax in axes:
ax.set(xticks=[], yticks=[])
return fig, axes
main()
```
#### 11 pyecharts绘制仪表盘
使用pip install pyecharts 安装,版本为 v1.6,pyecharts绘制仪表盘,只需要几行代码:
```python
from pyecharts import charts
# 仪表盘
gauge = charts.Gauge()
gauge.add('Python小例子', [('Python机器学习', 30), ('Python基础', 70.),
('Python正则', 90)])
gauge.render(path="./data/仪表盘.html")
print('ok')
```
仪表盘中共展示三项,每项的比例为30%,70%,90%,如下图默认名称显示第一项:Python机器学习,完成比例为30%
对应代码:
```python
import matplotlib.pyplot as plt
import numpy as np
from matplotlib.cbook import get_sample_data
import example_utils
z = np.load(get_sample_data('bivariate_normal.npy'))
fig, axes = example_utils.setup_axes()
axes[0].contour(z, cmap='gist_earth')
example_utils.label(axes[0], 'contour')
axes[1].contourf(z, cmap='gist_earth')
example_utils.label(axes[1], 'contourf')
axes[2].contourf(z, cmap='gist_earth')
cont = axes[2].contour(z, colors='black')
axes[2].clabel(cont, fontsize=6)
example_utils.label(axes[2], 'contourf + contour\n + clabel')
# example_utils.title(fig, '"contour, contourf, clabel": Contour/label 2D data',
# y=0.96)
fig.savefig('contour_example.png', facecolor='none')
plt.show()
```
#### 10 imshow图

对应代码:
```python
import matplotlib.pyplot as plt
import numpy as np
from matplotlib.cbook import get_sample_data
from mpl_toolkits import axes_grid1
import example_utils
def main():
fig, axes = setup_axes()
plot(axes, *load_data())
# example_utils.title(fig, '"ax.imshow(data, ...)": Colormapped or RGB arrays')
fig.savefig('imshow_example.png', facecolor='none')
plt.show()
def plot(axes, img_data, scalar_data, ny):
# 默认线性插值
axes[0].imshow(scalar_data, cmap='gist_earth', extent=[0, ny, ny, 0])
# 最近邻插值
axes[1].imshow(scalar_data, cmap='gist_earth', interpolation='nearest',
extent=[0, ny, ny, 0])
# 展示RGB/RGBA数据
axes[2].imshow(img_data)
def load_data():
img_data = plt.imread(get_sample_data('5.png'))
ny, nx, nbands = img_data.shape
scalar_data = np.load(get_sample_data('bivariate_normal.npy'))
return img_data, scalar_data, ny
def setup_axes():
fig = plt.figure(figsize=(6, 3))
axes = axes_grid1.ImageGrid(fig, [0, 0, .93, 1], (1, 3), axes_pad=0)
for ax in axes:
ax.set(xticks=[], yticks=[])
return fig, axes
main()
```
#### 11 pyecharts绘制仪表盘
使用pip install pyecharts 安装,版本为 v1.6,pyecharts绘制仪表盘,只需要几行代码:
```python
from pyecharts import charts
# 仪表盘
gauge = charts.Gauge()
gauge.add('Python小例子', [('Python机器学习', 30), ('Python基础', 70.),
('Python正则', 90)])
gauge.render(path="./data/仪表盘.html")
print('ok')
```
仪表盘中共展示三项,每项的比例为30%,70%,90%,如下图默认名称显示第一项:Python机器学习,完成比例为30%
 #### 12 pyecharts漏斗图
```python
from pyecharts import options as opts
from pyecharts.charts import Funnel, Page
from random import randint
def funnel_base() -> Funnel:
c = (
Funnel()
.add("豪车", [list(z) for z in zip(['宝马', '法拉利', '奔驰', '奥迪', '大众', '丰田', '特斯拉'],
[randint(1, 20) for _ in range(7)])])
.set_global_opts(title_opts=opts.TitleOpts(title="豪车漏斗图"))
)
return c
funnel_base().render('./img/car_fnnel.html')
```
以7种车型及某个属性值绘制的漏斗图,属性值大越靠近漏斗的大端。
#### 12 pyecharts漏斗图
```python
from pyecharts import options as opts
from pyecharts.charts import Funnel, Page
from random import randint
def funnel_base() -> Funnel:
c = (
Funnel()
.add("豪车", [list(z) for z in zip(['宝马', '法拉利', '奔驰', '奥迪', '大众', '丰田', '特斯拉'],
[randint(1, 20) for _ in range(7)])])
.set_global_opts(title_opts=opts.TitleOpts(title="豪车漏斗图"))
)
return c
funnel_base().render('./img/car_fnnel.html')
```
以7种车型及某个属性值绘制的漏斗图,属性值大越靠近漏斗的大端。
 #### 13 pyecharts日历图
```python
import datetime
import random
from pyecharts import options as opts
from pyecharts.charts import Calendar
def calendar_interval_1() -> Calendar:
begin = datetime.date(2019, 1, 1)
end = datetime.date(2019, 12, 27)
data = [
[str(begin + datetime.timedelta(days=i)), random.randint(1000, 25000)]
for i in range(0, (end - begin).days + 1, 2) # 隔天统计
]
calendar = (
Calendar(init_opts=opts.InitOpts(width="1200px")).add(
"", data, calendar_opts=opts.CalendarOpts(range_="2019"))
.set_global_opts(
title_opts=opts.TitleOpts(title="Calendar-2019年步数统计"),
visualmap_opts=opts.VisualMapOpts(
max_=25000,
min_=1000,
orient="horizontal",
is_piecewise=True,
pos_top="230px",
pos_left="100px",
),
)
)
return calendar
calendar_interval_1().render('./img/calendar.html')
```
绘制2019年1月1日到12月27日的步行数,官方给出的图形宽度`900px`不够,只能显示到9月份,本例使用`opts.InitOpts(width="1200px")`做出微调,并且`visualmap`显示所有步数,每隔一天显示一次:

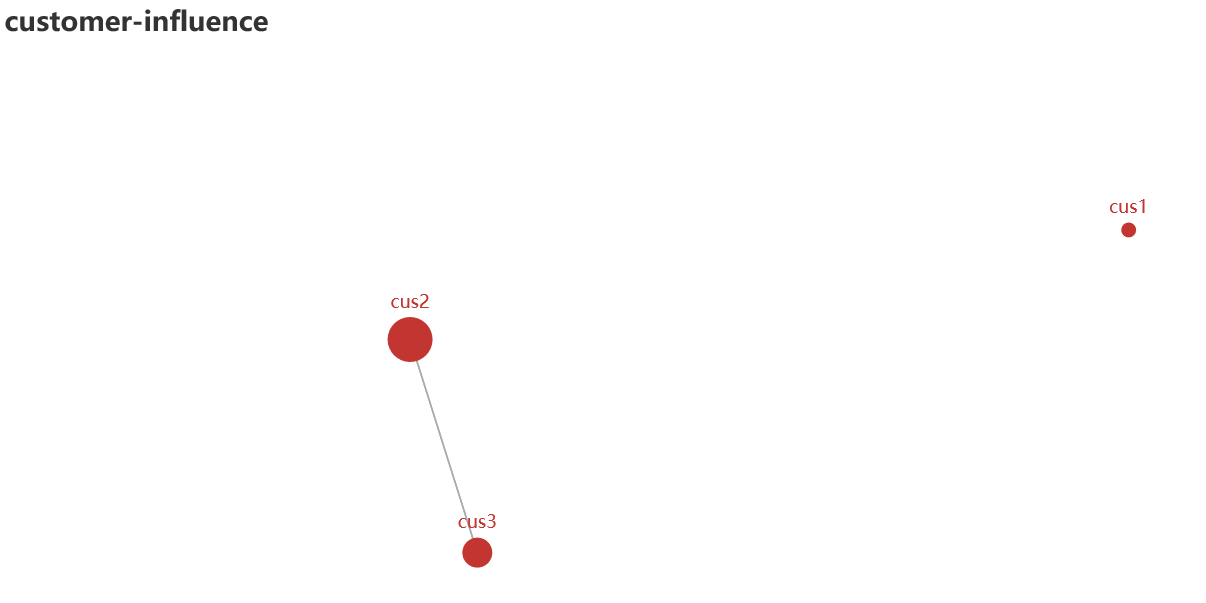
#### 14 pyecharts绘制graph图
```python
import json
import os
from pyecharts import options as opts
from pyecharts.charts import Graph, Page
def graph_base() -> Graph:
nodes = [
{"name": "cus1", "symbolSize": 10},
{"name": "cus2", "symbolSize": 30},
{"name": "cus3", "symbolSize": 20}
]
links = []
for i in nodes:
if i.get('name') == 'cus1':
continue
for j in nodes:
if j.get('name') == 'cus1':
continue
links.append({"source": i.get("name"), "target": j.get("name")})
c = (
Graph()
.add("", nodes, links, repulsion=8000)
.set_global_opts(title_opts=opts.TitleOpts(title="customer-influence"))
)
return c
```
构建图,其中客户点1与其他两个客户都没有关系(`link`),也就是不存在有效边:
#### 15 pyecharts水球图
```python
from pyecharts import options as opts
from pyecharts.charts import Liquid, Page
from pyecharts.globals import SymbolType
def liquid() -> Liquid:
c = (
Liquid()
.add("lq", [0.67, 0.30, 0.15])
.set_global_opts(title_opts=opts.TitleOpts(title="Liquid"))
)
return c
liquid().render('./img/liquid.html')
```
水球图的取值`[0.67, 0.30, 0.15]`表示下图中的`三个波浪线`,一般代表三个百分比:
#### 13 pyecharts日历图
```python
import datetime
import random
from pyecharts import options as opts
from pyecharts.charts import Calendar
def calendar_interval_1() -> Calendar:
begin = datetime.date(2019, 1, 1)
end = datetime.date(2019, 12, 27)
data = [
[str(begin + datetime.timedelta(days=i)), random.randint(1000, 25000)]
for i in range(0, (end - begin).days + 1, 2) # 隔天统计
]
calendar = (
Calendar(init_opts=opts.InitOpts(width="1200px")).add(
"", data, calendar_opts=opts.CalendarOpts(range_="2019"))
.set_global_opts(
title_opts=opts.TitleOpts(title="Calendar-2019年步数统计"),
visualmap_opts=opts.VisualMapOpts(
max_=25000,
min_=1000,
orient="horizontal",
is_piecewise=True,
pos_top="230px",
pos_left="100px",
),
)
)
return calendar
calendar_interval_1().render('./img/calendar.html')
```
绘制2019年1月1日到12月27日的步行数,官方给出的图形宽度`900px`不够,只能显示到9月份,本例使用`opts.InitOpts(width="1200px")`做出微调,并且`visualmap`显示所有步数,每隔一天显示一次:

#### 14 pyecharts绘制graph图
```python
import json
import os
from pyecharts import options as opts
from pyecharts.charts import Graph, Page
def graph_base() -> Graph:
nodes = [
{"name": "cus1", "symbolSize": 10},
{"name": "cus2", "symbolSize": 30},
{"name": "cus3", "symbolSize": 20}
]
links = []
for i in nodes:
if i.get('name') == 'cus1':
continue
for j in nodes:
if j.get('name') == 'cus1':
continue
links.append({"source": i.get("name"), "target": j.get("name")})
c = (
Graph()
.add("", nodes, links, repulsion=8000)
.set_global_opts(title_opts=opts.TitleOpts(title="customer-influence"))
)
return c
```
构建图,其中客户点1与其他两个客户都没有关系(`link`),也就是不存在有效边:

#### 15 pyecharts水球图
```python
from pyecharts import options as opts
from pyecharts.charts import Liquid, Page
from pyecharts.globals import SymbolType
def liquid() -> Liquid:
c = (
Liquid()
.add("lq", [0.67, 0.30, 0.15])
.set_global_opts(title_opts=opts.TitleOpts(title="Liquid"))
)
return c
liquid().render('./img/liquid.html')
```
水球图的取值`[0.67, 0.30, 0.15]`表示下图中的`三个波浪线`,一般代表三个百分比:
 #### 16 pyecharts饼图
```python
from pyecharts import options as opts
from pyecharts.charts import Pie
from random import randint
def pie_base() -> Pie:
c = (
Pie()
.add("", [list(z) for z in zip(['宝马', '法拉利', '奔驰', '奥迪', '大众', '丰田', '特斯拉'],
[randint(1, 20) for _ in range(7)])])
.set_global_opts(title_opts=opts.TitleOpts(title="Pie-基本示例"))
.set_series_opts(label_opts=opts.LabelOpts(formatter="{b}: {c}"))
)
return c
pie_base().render('./img/pie_pyecharts.html')
```
#### 16 pyecharts饼图
```python
from pyecharts import options as opts
from pyecharts.charts import Pie
from random import randint
def pie_base() -> Pie:
c = (
Pie()
.add("", [list(z) for z in zip(['宝马', '法拉利', '奔驰', '奥迪', '大众', '丰田', '特斯拉'],
[randint(1, 20) for _ in range(7)])])
.set_global_opts(title_opts=opts.TitleOpts(title="Pie-基本示例"))
.set_series_opts(label_opts=opts.LabelOpts(formatter="{b}: {c}"))
)
return c
pie_base().render('./img/pie_pyecharts.html')
```
 #### 17 pyecharts极坐标图
```python
import random
from pyecharts import options as opts
from pyecharts.charts import Page, Polar
def polar_scatter0() -> Polar:
data = [(alpha, random.randint(1, 100)) for alpha in range(101)] # r = random.randint(1, 100)
print(data)
c = (
Polar()
.add("", data, type_="bar", label_opts=opts.LabelOpts(is_show=False))
.set_global_opts(title_opts=opts.TitleOpts(title="Polar"))
)
return c
polar_scatter0().render('./img/polar.html')
```
极坐标表示为`(夹角,半径)`,如(6,94)表示夹角为6,半径94的点:
#### 17 pyecharts极坐标图
```python
import random
from pyecharts import options as opts
from pyecharts.charts import Page, Polar
def polar_scatter0() -> Polar:
data = [(alpha, random.randint(1, 100)) for alpha in range(101)] # r = random.randint(1, 100)
print(data)
c = (
Polar()
.add("", data, type_="bar", label_opts=opts.LabelOpts(is_show=False))
.set_global_opts(title_opts=opts.TitleOpts(title="Polar"))
)
return c
polar_scatter0().render('./img/polar.html')
```
极坐标表示为`(夹角,半径)`,如(6,94)表示夹角为6,半径94的点:
 #### 18 pyecharts词云图
```python
from pyecharts import options as opts
from pyecharts.charts import Page, WordCloud
from pyecharts.globals import SymbolType
words = [
("Python", 100),
("C++", 80),
("Java", 95),
("R", 50),
("JavaScript", 79),
("C", 65)
]
def wordcloud() -> WordCloud:
c = (
WordCloud()
# word_size_range: 单词字体大小范围
.add("", words, word_size_range=[20, 100], shape='cardioid')
.set_global_opts(title_opts=opts.TitleOpts(title="WordCloud"))
)
return c
wordcloud().render('./img/wordcloud.html')
```
`("C",65)`表示在本次统计中C语言出现65次
#### 18 pyecharts词云图
```python
from pyecharts import options as opts
from pyecharts.charts import Page, WordCloud
from pyecharts.globals import SymbolType
words = [
("Python", 100),
("C++", 80),
("Java", 95),
("R", 50),
("JavaScript", 79),
("C", 65)
]
def wordcloud() -> WordCloud:
c = (
WordCloud()
# word_size_range: 单词字体大小范围
.add("", words, word_size_range=[20, 100], shape='cardioid')
.set_global_opts(title_opts=opts.TitleOpts(title="WordCloud"))
)
return c
wordcloud().render('./img/wordcloud.html')
```
`("C",65)`表示在本次统计中C语言出现65次
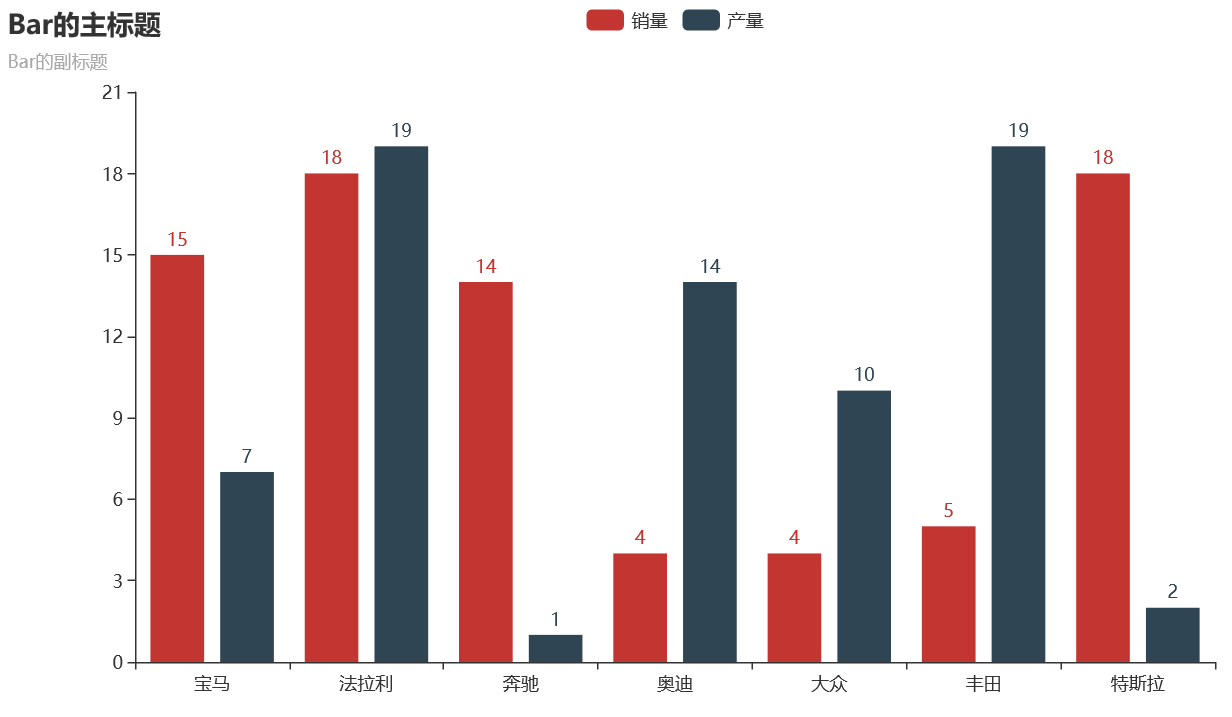
 #### 19 pyecharts系列柱状图
```python
from pyecharts import options as opts
from pyecharts.charts import Bar
from random import randint
def bar_series() -> Bar:
c = (
Bar()
.add_xaxis(['宝马', '法拉利', '奔驰', '奥迪', '大众', '丰田', '特斯拉'])
.add_yaxis("销量", [randint(1, 20) for _ in range(7)])
.add_yaxis("产量", [randint(1, 20) for _ in range(7)])
.set_global_opts(title_opts=opts.TitleOpts(title="Bar的主标题", subtitle="Bar的副标题"))
)
return c
bar_series().render('./img/bar_series.html')
```
#### 19 pyecharts系列柱状图
```python
from pyecharts import options as opts
from pyecharts.charts import Bar
from random import randint
def bar_series() -> Bar:
c = (
Bar()
.add_xaxis(['宝马', '法拉利', '奔驰', '奥迪', '大众', '丰田', '特斯拉'])
.add_yaxis("销量", [randint(1, 20) for _ in range(7)])
.add_yaxis("产量", [randint(1, 20) for _ in range(7)])
.set_global_opts(title_opts=opts.TitleOpts(title="Bar的主标题", subtitle="Bar的副标题"))
)
return c
bar_series().render('./img/bar_series.html')
```
 #### 20 pyecharts热力图
```python
import random
from pyecharts import options as opts
from pyecharts.charts import HeatMap
def heatmap_car() -> HeatMap:
x = ['宝马', '法拉利', '奔驰', '奥迪', '大众', '丰田', '特斯拉']
y = ['中国','日本','南非','澳大利亚','阿根廷','阿尔及利亚','法国','意大利','加拿大']
value = [[i, j, random.randint(0, 100)]
for i in range(len(x)) for j in range(len(y))]
c = (
HeatMap()
.add_xaxis(x)
.add_yaxis("销量", y, value)
.set_global_opts(
title_opts=opts.TitleOpts(title="HeatMap"),
visualmap_opts=opts.VisualMapOpts(),
)
)
return c
heatmap_car().render('./img/heatmap_pyecharts.html')
```
热力图描述的实际是三维关系,x轴表示车型,y轴表示国家,每个色块的颜色值代表销量,颜色刻度尺显示在左下角,颜色越红表示销量越大。
#### 20 pyecharts热力图
```python
import random
from pyecharts import options as opts
from pyecharts.charts import HeatMap
def heatmap_car() -> HeatMap:
x = ['宝马', '法拉利', '奔驰', '奥迪', '大众', '丰田', '特斯拉']
y = ['中国','日本','南非','澳大利亚','阿根廷','阿尔及利亚','法国','意大利','加拿大']
value = [[i, j, random.randint(0, 100)]
for i in range(len(x)) for j in range(len(y))]
c = (
HeatMap()
.add_xaxis(x)
.add_yaxis("销量", y, value)
.set_global_opts(
title_opts=opts.TitleOpts(title="HeatMap"),
visualmap_opts=opts.VisualMapOpts(),
)
)
return c
heatmap_car().render('./img/heatmap_pyecharts.html')
```
热力图描述的实际是三维关系,x轴表示车型,y轴表示国家,每个色块的颜色值代表销量,颜色刻度尺显示在左下角,颜色越红表示销量越大。
 ### 八、Python实战
#### 1 环境搭建
区分几个小白容易混淆的概念:pycharm,python解释器,conda安装,pip安装,总结来说:
- `pycharm`是python开发的集成开发环境(Integrated Development Environment,简称IDE),它本身无法执行Python代码
- `python解释器`才是真正执行代码的工具,pycharm里可设置Python解释器,一般去python官网下载python3.7或python3.8版本;如果安装过`anaconda`,它里面必然也包括一个某版本的Python解释器;pycharm配置python解释器选择哪一个都可以。
- anaconda是python常用包的合集,并提供给我们使用`conda`命令非常方便的安装各种Python包。
- `conda安装`:我们安装过anaconda软件后,就能够使用conda命令下载anaconda源里(比如中科大镜像源)的包
- `pip安装`:类似于conda安装的python安装包的方法
**修改镜像源**
在使用安装`conda` 安装某些包会出现慢或安装失败问题,最有效方法是修改镜像源为国内镜像源。之前都选用清华镜像源,但是2019年后已停止服务。推荐选用中科大镜像源。
先查看已经安装过的镜像源,cmd窗口执行命令:
```python
conda config --show
```
查看配置项`channels`,如果显示带有`tsinghua`,则说明已安装过清华镜像。
```python
channels:
- https://mirrors.tuna.tsinghua.edu.cn/tensorflow/linux/cpu/
- https://mirrors.tuna.tsinghua.edu.cn/anaconda/cloud/msys2/
- https://mirrors.tuna.tsinghua.edu.cn/anaconda/cloud/conda-forge/
- https://mirrors.tuna.tsinghua.edu.cn/anaconda/pkgs/free/
- https://mirrors.tuna.tsinghua.edu.cn/anaconda/cloud/pytorch/
```
下一步,使用`conda config --remove channels url地址 `删除清华镜像,如下命令删除第一个。然后,依次删除所有镜像源
```python
conda config --remove channels https://mirrors.tuna.tsinghua.edu.cn/tensorflow/linux/cpu/
```
添加目前可用的中科大镜像源:
```
conda config --add channels https://mirrors.ustc.edu.cn/anaconda/pkgs/free/
```
并设置搜索时显示通道地址:
```python
conda config --set show_channel_urls yes
```
确认是否安装镜像源成功,执行`conda config --show`,找到`channels`值为如下:
```
channels:
- https://mirrors.ustc.edu.cn/anaconda/pkgs/free/
- defaults
```
Done~
#### 2 自动群发邮件
Python自动群发邮件
```python
import smtplib
from email import (header)
from email.mime import (text, application, multipart)
import time
def sender_mail():
smt_p = smtplib.SMTP()
smt_p.connect(host='smtp.qq.com', port=25)
sender, password = '113097485@qq.com', "**************"
smt_p.login(sender, password)
receiver_addresses, count_num = [
'guozhennianhua@163.com', 'xiaoxiazi99@163.com'], 1
for email_address in receiver_addresses:
try:
msg = multipart.MIMEMultipart()
msg['From'] = "zhenguo"
msg['To'] = email_address
msg['subject'] = header.Header('这是邮件主题通知', 'utf-8')
msg.attach(text.MIMEText(
'这是一封测试邮件,请勿回复本邮件~', 'plain', 'utf-8'))
smt_p.sendmail(sender, email_address, msg.as_string())
time.sleep(10)
print('第%d次发送给%s' % (count_num, email_address))
count_num = count_num + 1
except Exception as e:
print('第%d次给%s发送邮件异常' % (count_num, email_address))
continue
smt_p.quit()
sender_mail()
```
注意:
发送邮箱是qq邮箱,所以要在qq邮箱中设置开启SMTP服务,设置完成时会生成一个授权码,将这个授权码赋值给文中的`password`变量。
发送后的截图:

#### 3 二分搜索
二分搜索是程序员必备的算法,无论什么场合,都要非常熟练地写出来。
小例子描述:
在**有序数组**`arr`中,指定区间`[left,right]`范围内,查找元素`x`
如果不存在,返回`-1`
二分搜索`binarySearch`实现的主逻辑
```python
def binarySearch(arr, left, right, x):
while left <= right:
mid = int(left + (right - left) / 2); # 找到中间位置。求中点写成(left+right)/2更容易溢出,所以不建议这样写
# 检查x是否出现在位置mid
if arr[mid] == x:
print('found %d 在索引位置%d 处' %(x,mid))
return mid
# 假如x更大,则不可能出现在左半部分
elif arr[mid] < x:
left = mid + 1 #搜索区间变为[mid+1,right]
print('区间缩小为[%d,%d]' %(mid+1,right))
# 同理,假如x更小,则不可能出现在右半部分
elif x conda3.05\Library\bin
`designer.exe`文件,双击启动:
### 八、Python实战
#### 1 环境搭建
区分几个小白容易混淆的概念:pycharm,python解释器,conda安装,pip安装,总结来说:
- `pycharm`是python开发的集成开发环境(Integrated Development Environment,简称IDE),它本身无法执行Python代码
- `python解释器`才是真正执行代码的工具,pycharm里可设置Python解释器,一般去python官网下载python3.7或python3.8版本;如果安装过`anaconda`,它里面必然也包括一个某版本的Python解释器;pycharm配置python解释器选择哪一个都可以。
- anaconda是python常用包的合集,并提供给我们使用`conda`命令非常方便的安装各种Python包。
- `conda安装`:我们安装过anaconda软件后,就能够使用conda命令下载anaconda源里(比如中科大镜像源)的包
- `pip安装`:类似于conda安装的python安装包的方法
**修改镜像源**
在使用安装`conda` 安装某些包会出现慢或安装失败问题,最有效方法是修改镜像源为国内镜像源。之前都选用清华镜像源,但是2019年后已停止服务。推荐选用中科大镜像源。
先查看已经安装过的镜像源,cmd窗口执行命令:
```python
conda config --show
```
查看配置项`channels`,如果显示带有`tsinghua`,则说明已安装过清华镜像。
```python
channels:
- https://mirrors.tuna.tsinghua.edu.cn/tensorflow/linux/cpu/
- https://mirrors.tuna.tsinghua.edu.cn/anaconda/cloud/msys2/
- https://mirrors.tuna.tsinghua.edu.cn/anaconda/cloud/conda-forge/
- https://mirrors.tuna.tsinghua.edu.cn/anaconda/pkgs/free/
- https://mirrors.tuna.tsinghua.edu.cn/anaconda/cloud/pytorch/
```
下一步,使用`conda config --remove channels url地址 `删除清华镜像,如下命令删除第一个。然后,依次删除所有镜像源
```python
conda config --remove channels https://mirrors.tuna.tsinghua.edu.cn/tensorflow/linux/cpu/
```
添加目前可用的中科大镜像源:
```
conda config --add channels https://mirrors.ustc.edu.cn/anaconda/pkgs/free/
```
并设置搜索时显示通道地址:
```python
conda config --set show_channel_urls yes
```
确认是否安装镜像源成功,执行`conda config --show`,找到`channels`值为如下:
```
channels:
- https://mirrors.ustc.edu.cn/anaconda/pkgs/free/
- defaults
```
Done~
#### 2 自动群发邮件
Python自动群发邮件
```python
import smtplib
from email import (header)
from email.mime import (text, application, multipart)
import time
def sender_mail():
smt_p = smtplib.SMTP()
smt_p.connect(host='smtp.qq.com', port=25)
sender, password = '113097485@qq.com', "**************"
smt_p.login(sender, password)
receiver_addresses, count_num = [
'guozhennianhua@163.com', 'xiaoxiazi99@163.com'], 1
for email_address in receiver_addresses:
try:
msg = multipart.MIMEMultipart()
msg['From'] = "zhenguo"
msg['To'] = email_address
msg['subject'] = header.Header('这是邮件主题通知', 'utf-8')
msg.attach(text.MIMEText(
'这是一封测试邮件,请勿回复本邮件~', 'plain', 'utf-8'))
smt_p.sendmail(sender, email_address, msg.as_string())
time.sleep(10)
print('第%d次发送给%s' % (count_num, email_address))
count_num = count_num + 1
except Exception as e:
print('第%d次给%s发送邮件异常' % (count_num, email_address))
continue
smt_p.quit()
sender_mail()
```
注意:
发送邮箱是qq邮箱,所以要在qq邮箱中设置开启SMTP服务,设置完成时会生成一个授权码,将这个授权码赋值给文中的`password`变量。
发送后的截图:

#### 3 二分搜索
二分搜索是程序员必备的算法,无论什么场合,都要非常熟练地写出来。
小例子描述:
在**有序数组**`arr`中,指定区间`[left,right]`范围内,查找元素`x`
如果不存在,返回`-1`
二分搜索`binarySearch`实现的主逻辑
```python
def binarySearch(arr, left, right, x):
while left <= right:
mid = int(left + (right - left) / 2); # 找到中间位置。求中点写成(left+right)/2更容易溢出,所以不建议这样写
# 检查x是否出现在位置mid
if arr[mid] == x:
print('found %d 在索引位置%d 处' %(x,mid))
return mid
# 假如x更大,则不可能出现在左半部分
elif arr[mid] < x:
left = mid + 1 #搜索区间变为[mid+1,right]
print('区间缩小为[%d,%d]' %(mid+1,right))
# 同理,假如x更小,则不可能出现在右半部分
elif x conda3.05\Library\bin
`designer.exe`文件,双击启动:
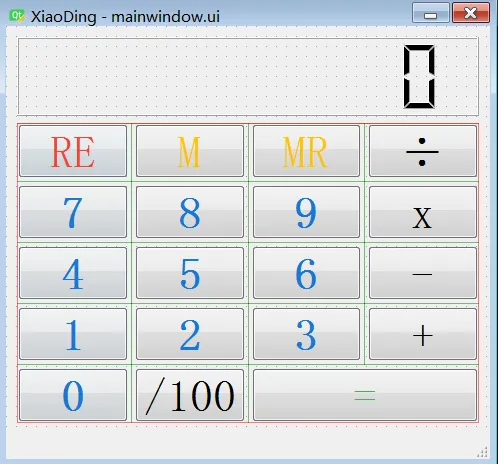
 创建窗体,命名为`XiaoDing`,整个的界面如下所示:

创建窗体,命名为`XiaoDing`,整个的界面如下所示:

 `qt 设计器`提供的常用控件基本都能满足开发需求,通过拖动左侧的控件,很便捷的就能搭建出如下的UI界面,比传统的手写控件代码要方便很多。
最终设计的计算器`XiaoDing`界面如下,
`qt 设计器`提供的常用控件基本都能满足开发需求,通过拖动左侧的控件,很便捷的就能搭建出如下的UI界面,比传统的手写控件代码要方便很多。
最终设计的计算器`XiaoDing`界面如下,
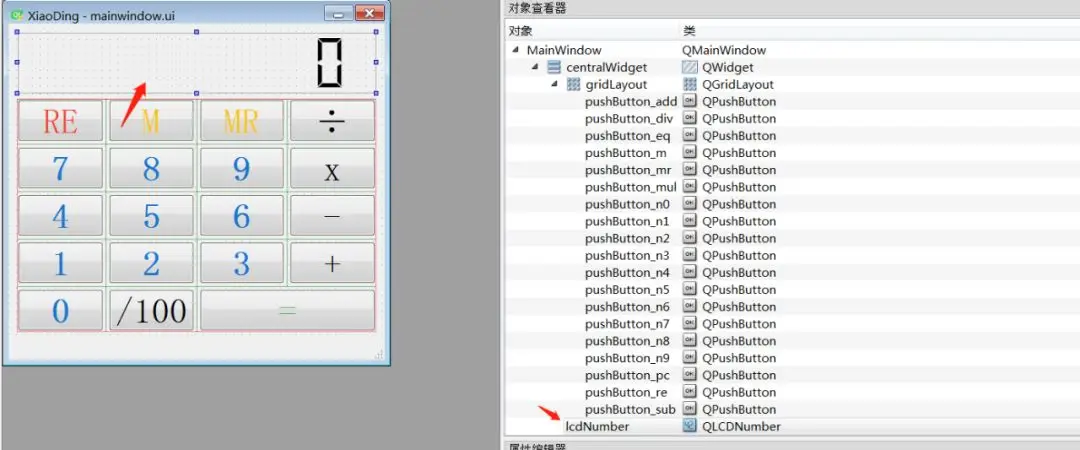
 比如,其中一个用于计算器显示的对象:`lcdNumber`,对象的类型为:`LCD Number`。右侧为计算器中用到的所有对象。
 2) 转py文件
使用如下命令,将设计好的`ui`文件转为`py`文件:
```python
pyuic5 -o ./calculator/MainWindow.py ./calculator/mainwindow.ui
```
3) 计算器实现逻辑
导入库:
```python
from PyQt5.QtGui import *
from PyQt5.QtWidgets import *
from PyQt5.QtCore import *
import operator
from MainWindow import Ui_MainWindow
```
主题代码逻辑很精简:
```python
# Calculator state.
READY = 0
INPUT = 1
class MainWindow(QMainWindow, Ui_MainWindow):
def __init__(self, *args, **kwargs):
super(MainWindow, self).__init__(*args, **kwargs)
self.setupUi(self)
# Setup numbers.
for n in range(0, 10):
getattr(self, 'pushButton_n%s' % n).pressed.connect(lambda v=n: self.input_number(v))
# Setup operations.
self.pushButton_add.pressed.connect(lambda: self.operation(operator.add))
self.pushButton_sub.pressed.connect(lambda: self.operation(operator.sub))
self.pushButton_mul.pressed.connect(lambda: self.operation(operator.mul))
self.pushButton_div.pressed.connect(lambda: self.operation(operator.truediv)) # operator.div for Python2.7
self.pushButton_pc.pressed.connect(self.operation_pc)
self.pushButton_eq.pressed.connect(self.equals)
# Setup actions
self.actionReset.triggered.connect(self.reset)
self.pushButton_ac.pressed.connect(self.reset)
self.actionExit.triggered.connect(self.close)
self.pushButton_m.pressed.connect(self.memory_store)
self.pushButton_mr.pressed.connect(self.memory_recall)
self.memory = 0
self.reset()
self.show()
```
基础方法:
```python
def input_number(self, v):
if self.state == READY:
self.state = INPUT
self.stack[-1] = v
else:
self.stack[-1] = self.stack[-1] * 10 + v
self.display()
def display(self):
self.lcdNumber.display(self.stack[-1])
```
按钮`RE`,`M`, `RE`对应的实现逻辑:
```python
def reset(self):
self.state = READY
self.stack = [0]
self.last_operation = None
self.current_op = None
self.display()
def memory_store(self):
self.memory = self.lcdNumber.value()
def memory_recall(self):
self.state = INPUT
self.stack[-1] = self.memory
self.display()
```
`+`,`-`,`x`,`/`,`/100`对应实现方法:
```python
def operation(self, op):
if self.current_op: # Complete the current operation
self.equals()
self.stack.append(0)
self.state = INPUT
self.current_op = op
def operation_pc(self):
self.state = INPUT
self.stack[-1] *= 0.01
self.display()
```
`=`号对应的方法实现:
```python
def equals(self):
if self.state == READY and self.last_operation:
s, self.current_op = self.last_operation
self.stack.append(s)
if self.current_op:
self.last_operation = self.stack[-1], self.current_op
try:
self.stack = [self.current_op(*self.stack)]
except Exception:
self.lcdNumber.display('Err')
self.stack = [0]
else:
self.current_op = None
self.state = READY
self.display()
```
main函数:
```python
if __name__ == '__main__':
app = QApplication([])
app.setApplicationName("XiaoDing")
window = MainWindow()
app.exec_()
```
2) 转py文件
使用如下命令,将设计好的`ui`文件转为`py`文件:
```python
pyuic5 -o ./calculator/MainWindow.py ./calculator/mainwindow.ui
```
3) 计算器实现逻辑
导入库:
```python
from PyQt5.QtGui import *
from PyQt5.QtWidgets import *
from PyQt5.QtCore import *
import operator
from MainWindow import Ui_MainWindow
```
主题代码逻辑很精简:
```python
# Calculator state.
READY = 0
INPUT = 1
class MainWindow(QMainWindow, Ui_MainWindow):
def __init__(self, *args, **kwargs):
super(MainWindow, self).__init__(*args, **kwargs)
self.setupUi(self)
# Setup numbers.
for n in range(0, 10):
getattr(self, 'pushButton_n%s' % n).pressed.connect(lambda v=n: self.input_number(v))
# Setup operations.
self.pushButton_add.pressed.connect(lambda: self.operation(operator.add))
self.pushButton_sub.pressed.connect(lambda: self.operation(operator.sub))
self.pushButton_mul.pressed.connect(lambda: self.operation(operator.mul))
self.pushButton_div.pressed.connect(lambda: self.operation(operator.truediv)) # operator.div for Python2.7
self.pushButton_pc.pressed.connect(self.operation_pc)
self.pushButton_eq.pressed.connect(self.equals)
# Setup actions
self.actionReset.triggered.connect(self.reset)
self.pushButton_ac.pressed.connect(self.reset)
self.actionExit.triggered.connect(self.close)
self.pushButton_m.pressed.connect(self.memory_store)
self.pushButton_mr.pressed.connect(self.memory_recall)
self.memory = 0
self.reset()
self.show()
```
基础方法:
```python
def input_number(self, v):
if self.state == READY:
self.state = INPUT
self.stack[-1] = v
else:
self.stack[-1] = self.stack[-1] * 10 + v
self.display()
def display(self):
self.lcdNumber.display(self.stack[-1])
```
按钮`RE`,`M`, `RE`对应的实现逻辑:
```python
def reset(self):
self.state = READY
self.stack = [0]
self.last_operation = None
self.current_op = None
self.display()
def memory_store(self):
self.memory = self.lcdNumber.value()
def memory_recall(self):
self.state = INPUT
self.stack[-1] = self.memory
self.display()
```
`+`,`-`,`x`,`/`,`/100`对应实现方法:
```python
def operation(self, op):
if self.current_op: # Complete the current operation
self.equals()
self.stack.append(0)
self.state = INPUT
self.current_op = op
def operation_pc(self):
self.state = INPUT
self.stack[-1] *= 0.01
self.display()
```
`=`号对应的方法实现:
```python
def equals(self):
if self.state == READY and self.last_operation:
s, self.current_op = self.last_operation
self.stack.append(s)
if self.current_op:
self.last_operation = self.stack[-1], self.current_op
try:
self.stack = [self.current_op(*self.stack)]
except Exception:
self.lcdNumber.display('Err')
self.stack = [0]
else:
self.current_op = None
self.state = READY
self.display()
```
main函数:
```python
if __name__ == '__main__':
app = QApplication([])
app.setApplicationName("XiaoDing")
window = MainWindow()
app.exec_()
```
 ### 第九章 Python基础算法
#### 1 领略算法魅力
深刻研究排序算法是入门算法较为好的一种方法,现在还记得4年前手动实现常见8种排序算法,通过随机生成一些数据,逐个校验代码实现的排序过程是否与预期的一致,越做越有劲,越有劲越想去研究,公交车上,吃饭的路上。。。那些画面,现在依然记忆犹新。
能力有限,当时并没有生成排序过程的动画,所以这些年想着抽时间一定把排序的过程都制作成动画,然后分享出来,让更多的小伙伴看到,通过排序算法的动态演示动画,找到学习算法的真正乐趣,从而迈向一个新的认知领域。
当时我还是用C++写的,时过境迁,Python迅速崛起,得益于Python的简洁,接口易用,最近终于有人在github中开源了使用Python动画展示排序算法的项目,真是倍感幸运。
动画还是用matplotlib做出来的,这就更完美了,一边学完美的算法,一边还能提升Python熟练度,一边还能学到使用matplotlib制作动画。
#### 2 快速排序动画展示
一个随机序列,使用快速排序算法,由小到大排序的过程:

#### 3 归并排序动画展示
一个随机序列,使用归并排序算法,由小到大排序的过程:

#### 4 堆排序动画展示
一个随机序列,使用堆排序算法,由小到大排序的过程:

这些算法动画使用Matplotlib制作,接下来逐个补充。
### 第十章 Python机器学习
#### 1 引言
机器学习是一个目标函数优化问题,给定目标函数f,约束条件会有一般包括以下三类:
1. 仅含等式约束
2. 仅含不等式约束
3. 等式和不等式约束混合型
当然还有一类没有任何约束条件的最优化问题
关于最优化问题,大都令人比较头疼,首先大多教材讲解通篇都是公式,各种符号表达,各种梯度,叫人看的云里雾里。
有没有结合几何图形阐述以上问题的?很庆幸,还真有这么好的讲解材料,图文并茂,逻辑推导严谨,更容易叫我们理解`拉格朗日乘数法`、`KKT条件`为什么就能求出极值。
#### 2 仅含等式约束
假定目标函数是连续可导函数,问题定义如下:

然后:
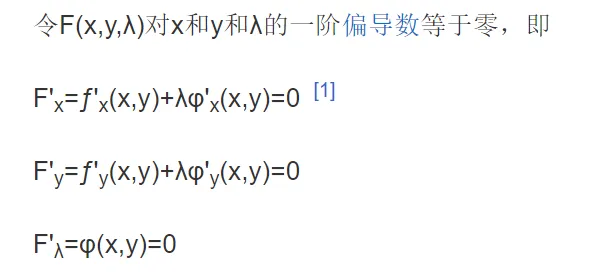
通过以上方法求解此类问题,但是为什么它能求出极值呢?
#### 3 找找感觉
大家时间都有限,只列出最核心的逻辑,找找sense, 如有兴趣可回去下载PPT仔细体会。
此解释中对此类问题的定义:

为了更好的阐述,给定一个具体例子,锁定:
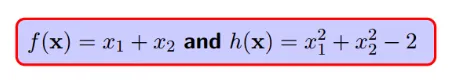
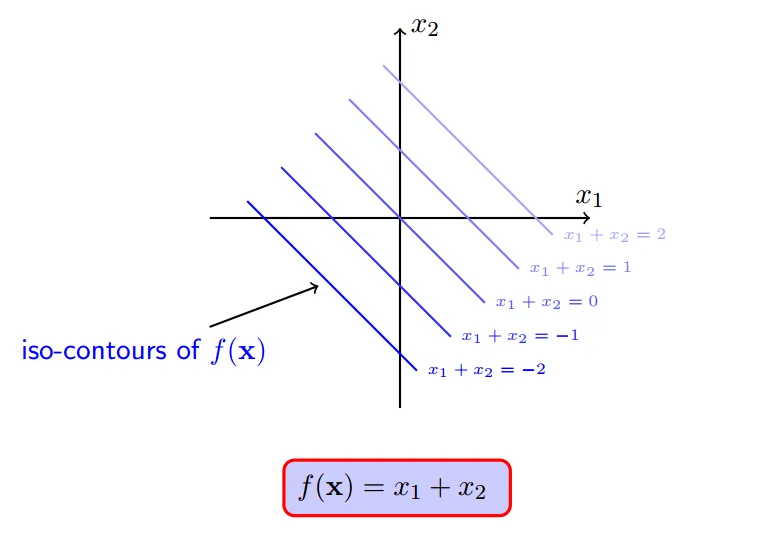
所以,f(x)的一系列取值包括0,1,100,10000等任意实数:
但是,约束条件`h(x)`注定会约束`f(x)`不会等于100,不会等于10000...
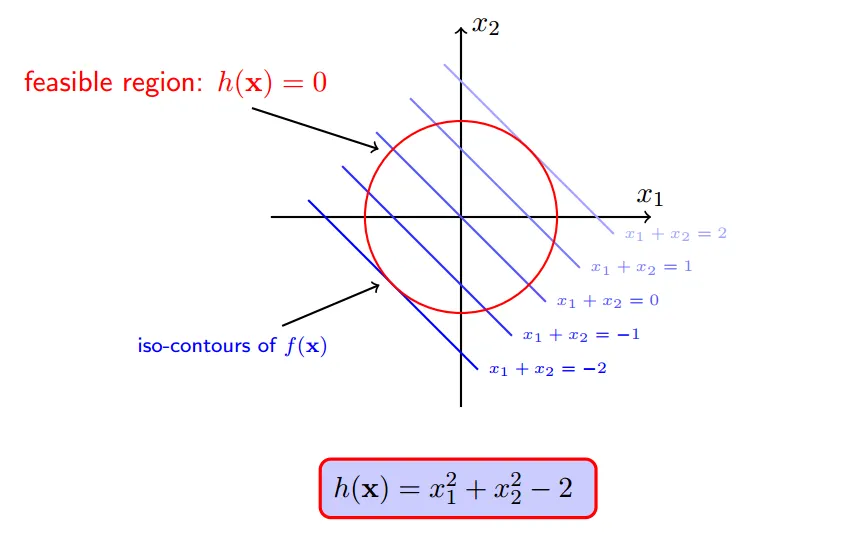
一个可行点:
#### 4 梯度下降
我们想要寻找一个移动`x`的规则,使得移动后`f(x+delta_x)`变小,当然必须满足约束`h(x+delta_x)=0`
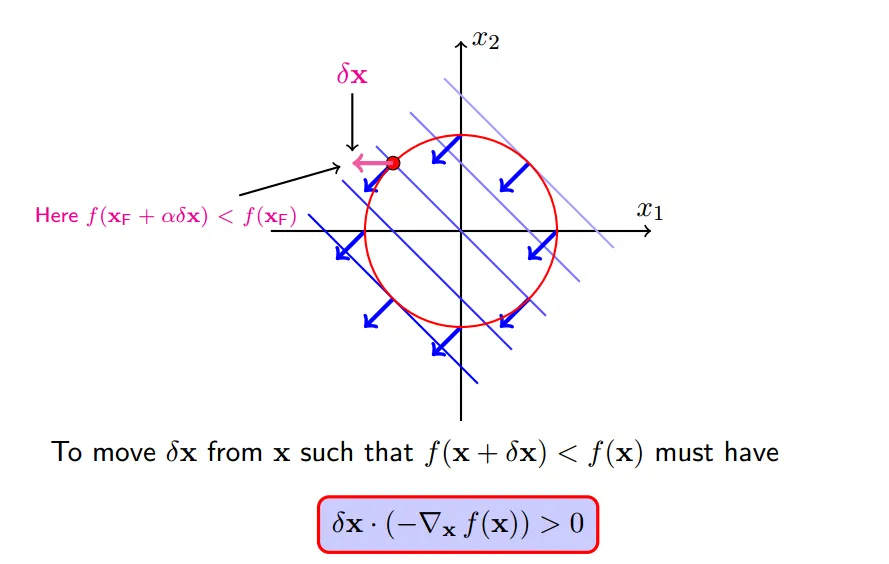
使得`f(x`)减小最快的方向就是它的梯度反方向,即
因此,要想f(x+delta_x) 变小,通过图形可以看出,只要保持和梯度反方向夹角小于90,也就是保持大概一个方向,`f(x+delta_x)`就会变小,转化为公式就是:
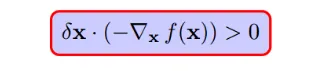
如下所示的一个`delta_x`就是一个会使得f(x)减小的方向,但是这种移动将会破坏等式约束: `h(x)=0`,关于准确的移动方向下面第四小节会讲到
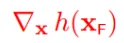
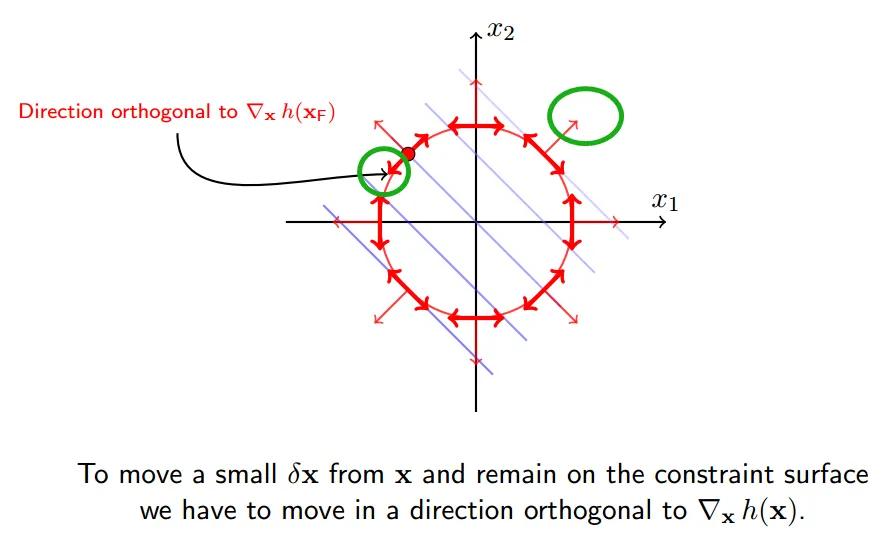
#### 5 约束面的法向
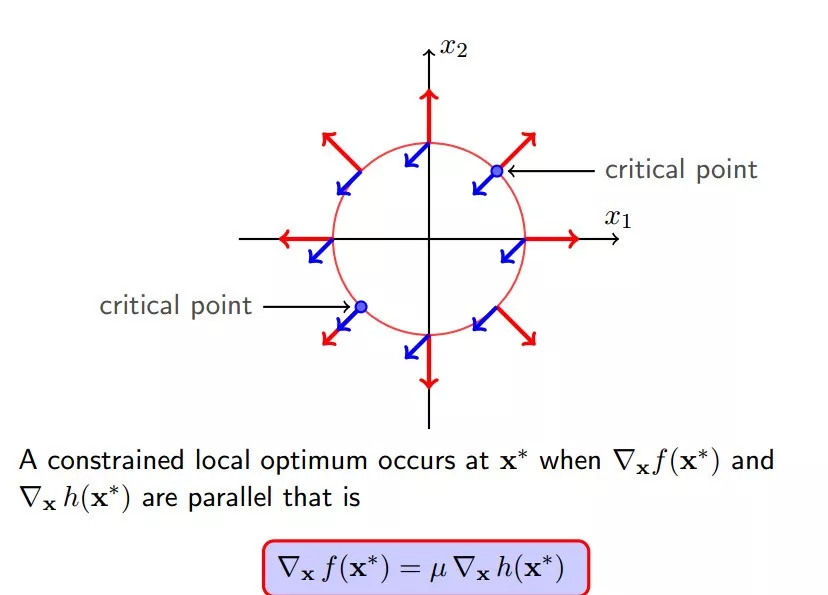
约束面的外法向:
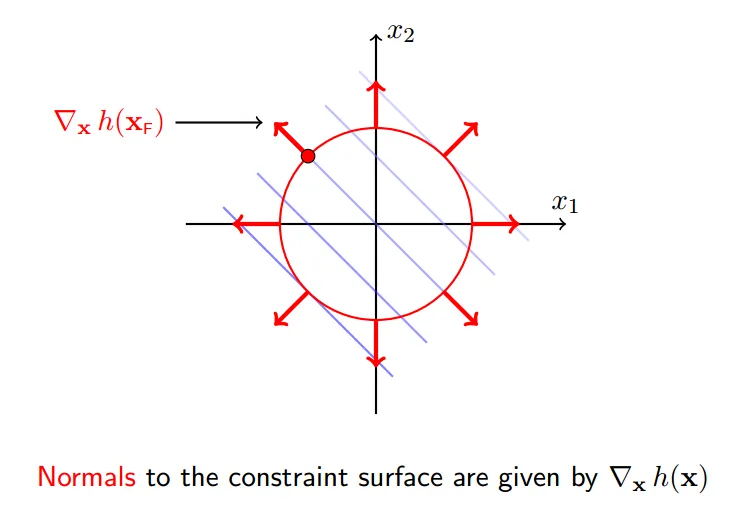
约束面的内法向:
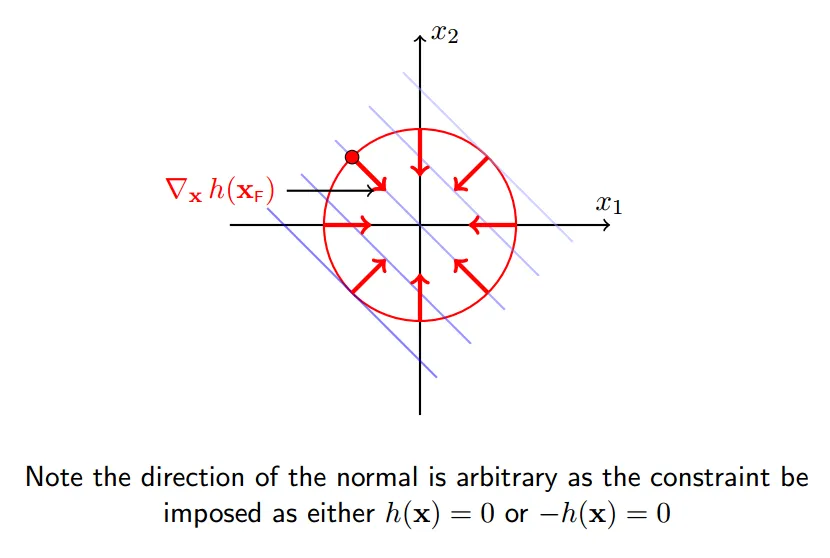
绿圈表示法向的`正交`方向
**x沿着绿圈内的方向移动,将会使得f(x)减小,同时满足等式约束h(x) = 0**
#### 6 大胆猜想
我们不妨大胆假设,如果满足下面的条件:

根据第四小节讲述,`delta_x`必须正交于`h(x)`,所以:
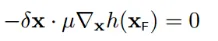
所以:
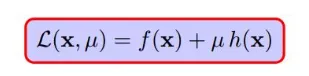
至此,我们就找到`f(x)`偏导数等于0的点,就是下图所示的**两个关键点(它们也是f(x)与h(x)的临界点)**。且必须满足以下条件,也就是两个向量必须是平行的:
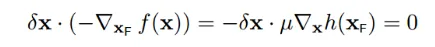
#### 7 完全解码拉格朗日乘数法
至此,已经完全解码拉格朗日乘数法,拉格朗日巧妙的构造出下面这个式子:
**还有取得极值的的三个条件,都是对以上五个小节中涉及到的条件的编码**
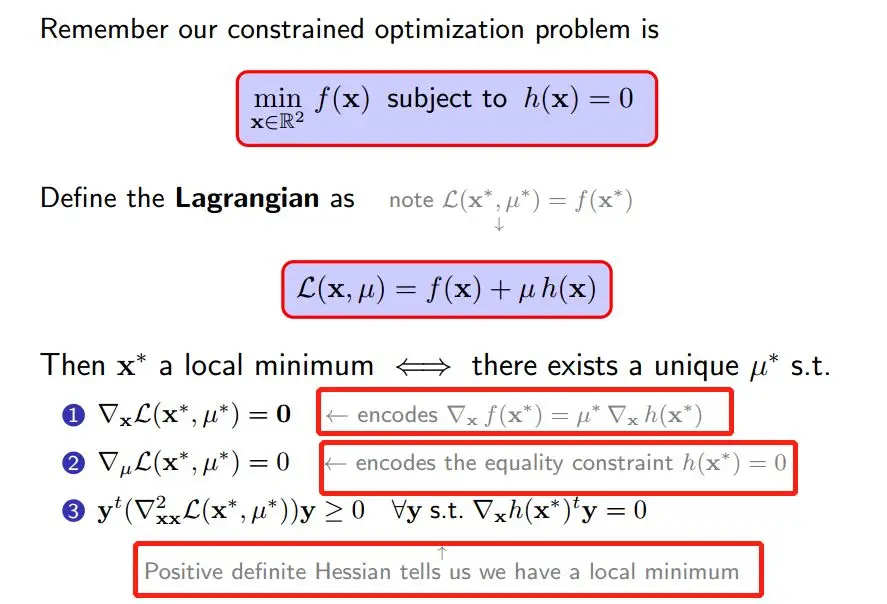
关于第三个条件,稍加说明。
对于含有多个变量,比如本例子就含有2个变量`x1`, `x2`,就是一个多元优化问题,需要求二阶导,二阶导的矩阵就被称为`海塞矩阵`(Hessian Matrix)
与求解一元问题一样,仅凭一阶导数等于是无法判断极值的,需要求二阶导,并且二阶导大于0才是极小值,小于0是极大值,等于0依然无法判断是否在此点去的极值。
> 以上就是机器学习最常用的优化技巧:拉格朗日乘数法的图形讲解,相信大家已经找到一定感觉,接下来几天我们通过例子,详细阐述机器学习的具体概念,常用算法,使用Python实现主要的算法,使用Sklearn,Kaggle数据实战这些算法。
### 第九章 Python基础算法
#### 1 领略算法魅力
深刻研究排序算法是入门算法较为好的一种方法,现在还记得4年前手动实现常见8种排序算法,通过随机生成一些数据,逐个校验代码实现的排序过程是否与预期的一致,越做越有劲,越有劲越想去研究,公交车上,吃饭的路上。。。那些画面,现在依然记忆犹新。
能力有限,当时并没有生成排序过程的动画,所以这些年想着抽时间一定把排序的过程都制作成动画,然后分享出来,让更多的小伙伴看到,通过排序算法的动态演示动画,找到学习算法的真正乐趣,从而迈向一个新的认知领域。
当时我还是用C++写的,时过境迁,Python迅速崛起,得益于Python的简洁,接口易用,最近终于有人在github中开源了使用Python动画展示排序算法的项目,真是倍感幸运。
动画还是用matplotlib做出来的,这就更完美了,一边学完美的算法,一边还能提升Python熟练度,一边还能学到使用matplotlib制作动画。
#### 2 快速排序动画展示
一个随机序列,使用快速排序算法,由小到大排序的过程:

#### 3 归并排序动画展示
一个随机序列,使用归并排序算法,由小到大排序的过程:

#### 4 堆排序动画展示
一个随机序列,使用堆排序算法,由小到大排序的过程:

这些算法动画使用Matplotlib制作,接下来逐个补充。
### 第十章 Python机器学习
#### 1 引言
机器学习是一个目标函数优化问题,给定目标函数f,约束条件会有一般包括以下三类:
1. 仅含等式约束
2. 仅含不等式约束
3. 等式和不等式约束混合型
当然还有一类没有任何约束条件的最优化问题
关于最优化问题,大都令人比较头疼,首先大多教材讲解通篇都是公式,各种符号表达,各种梯度,叫人看的云里雾里。
有没有结合几何图形阐述以上问题的?很庆幸,还真有这么好的讲解材料,图文并茂,逻辑推导严谨,更容易叫我们理解`拉格朗日乘数法`、`KKT条件`为什么就能求出极值。
#### 2 仅含等式约束
假定目标函数是连续可导函数,问题定义如下:

然后:

通过以上方法求解此类问题,但是为什么它能求出极值呢?
#### 3 找找感觉
大家时间都有限,只列出最核心的逻辑,找找sense, 如有兴趣可回去下载PPT仔细体会。
此解释中对此类问题的定义:

为了更好的阐述,给定一个具体例子,锁定:

所以,f(x)的一系列取值包括0,1,100,10000等任意实数:

但是,约束条件`h(x)`注定会约束`f(x)`不会等于100,不会等于10000...

一个可行点:

#### 4 梯度下降
我们想要寻找一个移动`x`的规则,使得移动后`f(x+delta_x)`变小,当然必须满足约束`h(x+delta_x)=0`
使得`f(x`)减小最快的方向就是它的梯度反方向,即


因此,要想f(x+delta_x) 变小,通过图形可以看出,只要保持和梯度反方向夹角小于90,也就是保持大概一个方向,`f(x+delta_x)`就会变小,转化为公式就是:

如下所示的一个`delta_x`就是一个会使得f(x)减小的方向,但是这种移动将会破坏等式约束: `h(x)=0`,关于准确的移动方向下面第四小节会讲到

#### 5 约束面的法向
约束面的外法向:


约束面的内法向:

绿圈表示法向的`正交`方向
**x沿着绿圈内的方向移动,将会使得f(x)减小,同时满足等式约束h(x) = 0**

#### 6 大胆猜想
我们不妨大胆假设,如果满足下面的条件:

根据第四小节讲述,`delta_x`必须正交于`h(x)`,所以:

所以:

至此,我们就找到`f(x)`偏导数等于0的点,就是下图所示的**两个关键点(它们也是f(x)与h(x)的临界点)**。且必须满足以下条件,也就是两个向量必须是平行的:

#### 7 完全解码拉格朗日乘数法
至此,已经完全解码拉格朗日乘数法,拉格朗日巧妙的构造出下面这个式子:

**还有取得极值的的三个条件,都是对以上五个小节中涉及到的条件的编码**

关于第三个条件,稍加说明。
对于含有多个变量,比如本例子就含有2个变量`x1`, `x2`,就是一个多元优化问题,需要求二阶导,二阶导的矩阵就被称为`海塞矩阵`(Hessian Matrix)
与求解一元问题一样,仅凭一阶导数等于是无法判断极值的,需要求二阶导,并且二阶导大于0才是极小值,小于0是极大值,等于0依然无法判断是否在此点去的极值。
> 以上就是机器学习最常用的优化技巧:拉格朗日乘数法的图形讲解,相信大家已经找到一定感觉,接下来几天我们通过例子,详细阐述机器学习的具体概念,常用算法,使用Python实现主要的算法,使用Sklearn,Kaggle数据实战这些算法。 #### 4 Python数据分析
Python非常适合做数值计算、数据分析,一行代码完成数据透视:
```python
pd.pivot_table(df, index=['Manager', 'Rep'], values=['Price'], aggfunc=np.sum)
```
#### 5 Python机器学习
Python机器学习库`Sklearn`功能强大,接口易用,包括数据预处理模块、回归、分类、聚类、降维等。一行代码创建一个KMeans聚类模型:
```python
from sklearn.cluster import KMeans
KMeans( n_clusters=3 )
```

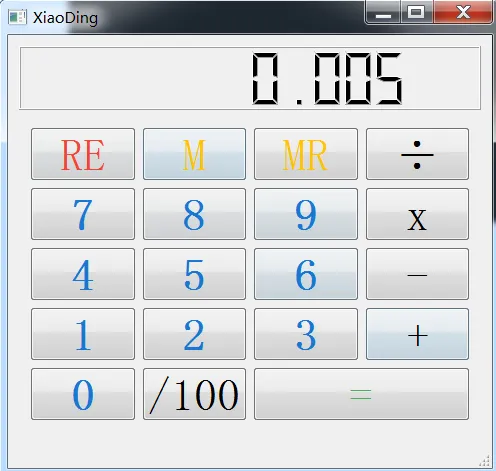
#### 6 Python-GUI
PyQt设计器开发GUI,能够迅速通过拖动组建搭建出来,使用方便。如下为使用PyQt,定制的一个专属自己的小而美的计算器。
除此之外,使用Python的Flask框架搭建Web框架,也非常方便。
总之,在这个`Python小例子`,你都能学到关于使用Python干活的方方面面的有趣的小例子,欢迎关注。
### 一、Python基础
`Python基础`主要总结Python常用内置函数;Python独有的语法特性、关键词`nonlocal`, ` global`等;内置数据结构包括:列表(list), 字典(dict), 集合(set), 元组(tuple) 以及相关的高级模块`collections`中的`Counter`, `namedtuple`, `defaultdict`,`heapq`模块。目前共有`82`个小例子
此章节一共包括`82个`基础小例子。
#### 1 求绝对值
绝对值或复数的模
```python
In [1]: abs(-6)
Out[1]: 6
```
#### 2 元素都为真
接受一个迭代器,如果迭代器的`所有元素`都为真,那么返回`True`,否则返回`False`
```python
In [2]: all([1,0,3,6])
Out[2]: False
In [3]: all([1,2,3])
Out[3]: True
```
#### 3 元素至少一个为真
接受一个迭代器,如果迭代器里`至少有一个`元素为真,那么返回`True`,否则返回`False`
```python
In [4]: any([0,0,0,[]])
Out[4]: False
In [5]: any([0,0,1])
Out[5]: True
```
#### 4 ascii展示对象
调用对象的__repr__() 方法,获得该方法的返回值,如下例子返回值为字符串
```python
In [1]: class Student():
...: def __init__(self,id,name):
...: self.id = id
...: self.name = name
...: def __repr__(self):
...: return 'id = '+self.id +', name = '+self.name
...:
...:
In [2]: xiaoming = Student(id='001',name='xiaoming')
In [3]: print(xiaoming)
id = 001, name = xiaoming
In [4]: ascii(xiaoming)
Out[4]: 'id = 001, name = xiaoming'
```
#### 5 十转二
将`十进制`转换为`二进制`
```python
In [1]: bin(10)
Out[1]: '0b1010'
```
#### 6 十转八
将`十进制`转换为`八进制`
```python
In [1]: oct(9)
Out[1]: '0o11'
```
#### 7 十转十六
将`十进制`转换为`十六进制`
```python
In [1]: hex(15)
Out[1]: '0xf'
```
#### 8 判断是真是假
测试一个对象是True, 还是False.
```python
In [1]: bool([0,0,0])
Out[1]: True
In [2]: bool([])
Out[2]: False
In [3]: bool([1,0,1])
Out[3]: True
```
#### 9 字符串转字节
将一个`字符串`转换成`字节`类型
```python
In [1]: s = "apple"
In [2]: bytes(s,encoding='utf-8')
Out[2]: b'apple'
```
#### 10 转为字符串
将`字符类型`、`数值类型`等转换为`字符串`类型
```python
In [1]: i = 100
In [2]: str(i)
Out[2]: '100'
```
#### 11 是否可调用
判断对象是否可被调用,能被调用的对象就是一个`callable` 对象,比如函数 `str`, `int` 等都是可被调用的,但是例子**4** 中`xiaoming`实例是不可被调用的:
```python
In [1]: callable(str)
Out[1]: True
In [2]: callable(int)
Out[2]: True
In [3]: xiaoming
Out[3]: id = 001, name = xiaoming
In [4]: callable(xiaoming)
Out[4]: False
```
如果想让`xiaoming`能被调用 xiaoming(), 需要重写`Student`类的`__call__`方法:
```python
In [1]: class Student():
...: def __init__(self,id,name):
...: self.id = id
...: self.name = name
...: def __repr__(self):
...: return 'id = '+self.id +', name = '+self.name
...: def __call__(self):
...: print('I can be called')
...: print(f'my name is {self.name}')
...:
...:
In [2]: t = Student('001','xiaoming')
In [3]: t()
I can be called
my name is xiaoming
```
#### 12 十转ASCII
查看十进制整数对应的`ASCII字符`
```python
In [1]: chr(65)
Out[1]: 'A'
```
#### 13 ASCII转十
查看某个`ASCII字符`对应的十进制数
```python
In [1]: ord('A')
Out[1]: 65
```
#### 14 静态方法
`classmethod` 装饰器对应的函数不需要实例化,不需要 `self `参数,但第一个参数需要是表示自身类的 cls 参数,可以来调用类的属性,类的方法,实例化对象等。
```python
In [1]: class Student():
...: def __init__(self,id,name):
...: self.id = id
...: self.name = name
...: def __repr__(self):
...: return 'id = '+self.id +', name = '+self.name
...: @classmethod
...: def f(cls):
...: print(cls)
```
#### 15 执行字符串表示的代码
将字符串编译成python能识别或可执行的代码,也可以将文字读成字符串再编译。
```python
In [1]: s = "print('helloworld')"
In [2]: r = compile(s,"
#### 4 Python数据分析
Python非常适合做数值计算、数据分析,一行代码完成数据透视:
```python
pd.pivot_table(df, index=['Manager', 'Rep'], values=['Price'], aggfunc=np.sum)
```
#### 5 Python机器学习
Python机器学习库`Sklearn`功能强大,接口易用,包括数据预处理模块、回归、分类、聚类、降维等。一行代码创建一个KMeans聚类模型:
```python
from sklearn.cluster import KMeans
KMeans( n_clusters=3 )
```

#### 6 Python-GUI
PyQt设计器开发GUI,能够迅速通过拖动组建搭建出来,使用方便。如下为使用PyQt,定制的一个专属自己的小而美的计算器。
除此之外,使用Python的Flask框架搭建Web框架,也非常方便。
总之,在这个`Python小例子`,你都能学到关于使用Python干活的方方面面的有趣的小例子,欢迎关注。
### 一、Python基础
`Python基础`主要总结Python常用内置函数;Python独有的语法特性、关键词`nonlocal`, ` global`等;内置数据结构包括:列表(list), 字典(dict), 集合(set), 元组(tuple) 以及相关的高级模块`collections`中的`Counter`, `namedtuple`, `defaultdict`,`heapq`模块。目前共有`82`个小例子
此章节一共包括`82个`基础小例子。
#### 1 求绝对值
绝对值或复数的模
```python
In [1]: abs(-6)
Out[1]: 6
```
#### 2 元素都为真
接受一个迭代器,如果迭代器的`所有元素`都为真,那么返回`True`,否则返回`False`
```python
In [2]: all([1,0,3,6])
Out[2]: False
In [3]: all([1,2,3])
Out[3]: True
```
#### 3 元素至少一个为真
接受一个迭代器,如果迭代器里`至少有一个`元素为真,那么返回`True`,否则返回`False`
```python
In [4]: any([0,0,0,[]])
Out[4]: False
In [5]: any([0,0,1])
Out[5]: True
```
#### 4 ascii展示对象
调用对象的__repr__() 方法,获得该方法的返回值,如下例子返回值为字符串
```python
In [1]: class Student():
...: def __init__(self,id,name):
...: self.id = id
...: self.name = name
...: def __repr__(self):
...: return 'id = '+self.id +', name = '+self.name
...:
...:
In [2]: xiaoming = Student(id='001',name='xiaoming')
In [3]: print(xiaoming)
id = 001, name = xiaoming
In [4]: ascii(xiaoming)
Out[4]: 'id = 001, name = xiaoming'
```
#### 5 十转二
将`十进制`转换为`二进制`
```python
In [1]: bin(10)
Out[1]: '0b1010'
```
#### 6 十转八
将`十进制`转换为`八进制`
```python
In [1]: oct(9)
Out[1]: '0o11'
```
#### 7 十转十六
将`十进制`转换为`十六进制`
```python
In [1]: hex(15)
Out[1]: '0xf'
```
#### 8 判断是真是假
测试一个对象是True, 还是False.
```python
In [1]: bool([0,0,0])
Out[1]: True
In [2]: bool([])
Out[2]: False
In [3]: bool([1,0,1])
Out[3]: True
```
#### 9 字符串转字节
将一个`字符串`转换成`字节`类型
```python
In [1]: s = "apple"
In [2]: bytes(s,encoding='utf-8')
Out[2]: b'apple'
```
#### 10 转为字符串
将`字符类型`、`数值类型`等转换为`字符串`类型
```python
In [1]: i = 100
In [2]: str(i)
Out[2]: '100'
```
#### 11 是否可调用
判断对象是否可被调用,能被调用的对象就是一个`callable` 对象,比如函数 `str`, `int` 等都是可被调用的,但是例子**4** 中`xiaoming`实例是不可被调用的:
```python
In [1]: callable(str)
Out[1]: True
In [2]: callable(int)
Out[2]: True
In [3]: xiaoming
Out[3]: id = 001, name = xiaoming
In [4]: callable(xiaoming)
Out[4]: False
```
如果想让`xiaoming`能被调用 xiaoming(), 需要重写`Student`类的`__call__`方法:
```python
In [1]: class Student():
...: def __init__(self,id,name):
...: self.id = id
...: self.name = name
...: def __repr__(self):
...: return 'id = '+self.id +', name = '+self.name
...: def __call__(self):
...: print('I can be called')
...: print(f'my name is {self.name}')
...:
...:
In [2]: t = Student('001','xiaoming')
In [3]: t()
I can be called
my name is xiaoming
```
#### 12 十转ASCII
查看十进制整数对应的`ASCII字符`
```python
In [1]: chr(65)
Out[1]: 'A'
```
#### 13 ASCII转十
查看某个`ASCII字符`对应的十进制数
```python
In [1]: ord('A')
Out[1]: 65
```
#### 14 静态方法
`classmethod` 装饰器对应的函数不需要实例化,不需要 `self `参数,但第一个参数需要是表示自身类的 cls 参数,可以来调用类的属性,类的方法,实例化对象等。
```python
In [1]: class Student():
...: def __init__(self,id,name):
...: self.id = id
...: self.name = name
...: def __repr__(self):
...: return 'id = '+self.id +', name = '+self.name
...: @classmethod
...: def f(cls):
...: print(cls)
```
#### 15 执行字符串表示的代码
将字符串编译成python能识别或可执行的代码,也可以将文字读成字符串再编译。
```python
In [1]: s = "print('helloworld')"
In [2]: r = compile(s,"