# blazor-charts
**Repository Path**: timchen44/blazor-charts
## Basic Information
- **Project Name**: blazor-charts
- **Description**: 基于blazor技术,使用C#编写的charts组件。Chart component library implemented using blazor
- **Primary Language**: C#
- **License**: MIT
- **Default Branch**: main
- **Homepage**: None
- **GVP Project**: No
## Statistics
- **Stars**: 3
- **Forks**: 1
- **Created**: 2021-04-28
- **Last Updated**: 2025-09-21
## Categories & Tags
**Categories**: Uncategorized
**Tags**: None
## README
# blazor-charts

基于blazor技术,使用C#编写的charts组件。
DemoSite: [https://victorious-meadow-0c2078000.azurestaticapps.net/](https://victorious-meadow-0c2078000.azurestaticapps.net/)
| Build | NuGet |
|--|--|
||[](https://www.nuget.org/packages/BlazorCharts)|
### 使用方法
1. 安装组件包
2. 修改`_Imports.razor`文件,添加引用`@using BlazorCharts`
3. 页面中使用
```html
```
```csharp
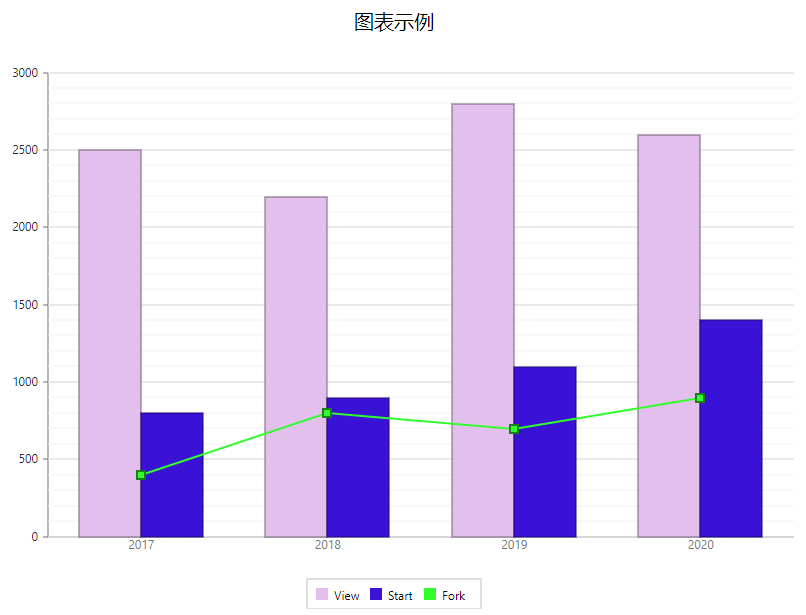
string title = "图表示例";
List githubs = new List()
{
new Github(){Year=2017,View =2500,Start=800,Fork=400},
new Github(){Year=2018,View =2200,Start=900,Fork=800},
new Github(){Year=2019,View =2800,Start=1100,Fork=700},
new Github(){Year=2020,View =2600,Start=1400,Fork=900},
};
public class Github
{
public int Year { get; set; }
public int View { get; set; }
public int Start { get; set; }
public int Fork { get; set; }
}
```
4. 执行查看效果
### 更新日志
**2021.0520**
- X轴和Y轴增加隐藏功能
- Y轴增加次要轴功能
**2021.0514**
- 支持某个字段作为分组依据进行分组
- 增加基本的数据筛选支持
**2021.0509**
- 柱状图和点的图增加动画
**2021.0501**
- 文档增加更新日志
- Title组件增加文本位置属性
- Y轴增加主要和次要的单位和网格线
- X轴增加网格线
- 优化Y轴刻度计算算法
- 坐标轴增加标签位置和文字偏移