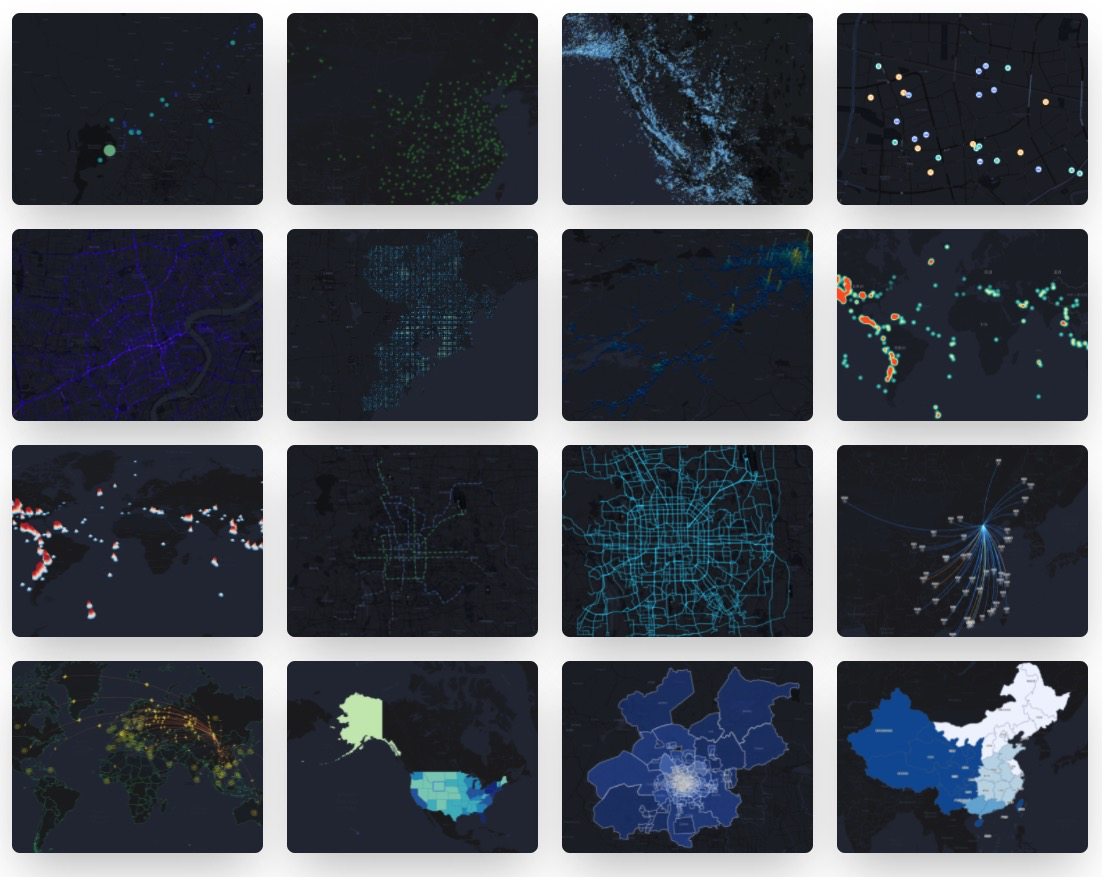
# antv-l7plot **Repository Path**: wlz-xb/antv-l7plot ## Basic Information - **Project Name**: antv-l7plot - **Description**: 🌍 Geospatial Visualization Chart Library - **Primary Language**: Unknown - **License**: MIT - **Default Branch**: main - **Homepage**: https://antv-l7plot.gitee.io - **GVP Project**: No ## Statistics - **Stars**: 0 - **Forks**: 3 - **Created**: 2022-08-23 - **Last Updated**: 2022-08-23 ## Categories & Tags **Categories**: Uncategorized **Tags**: None ## README [English](./README.en-US.md) | 简体中文

L7Plot

🌍 基于 L7 的地理空间可视化图表库。 [![Version](https://badgen.net/npm/v/@antv/l7plot)](https://npmjs.com/@antv/l7plot) ![Status](https://badgen.net/github/status/antvis/L7Plot) [![Release Status](https://github.com/antvis/L7Plot/workflows/release/badge.svg?branch=master)](https://github.com/antvis/L7Plot/actions?query=workflow:release) [![Coverage Status](https://coveralls.io/repos/github/antvis/L7Plot/badge.svg)](https://coveralls.io/github/antvis/L7Plot) [![Percentage of issues still open](http://isitmaintained.com/badge/open/antvis/l7plot.svg)](http://isitmaintained.com/project/antvis/l7plot 'Percentage of issues still open') [![Average time to resolve an issue](http://isitmaintained.com/badge/resolution/antvis/l7plot.svg)](http://isitmaintained.com/project/antvis/l7plot 'Average time to resolve an issue')

网站快速开始API图表示例

## ✨ 特性 - 📦 开箱即用:配置式的地理图表,内置多粒度行政数据 - 🚀 元素丰富:图表类型及地图组件丰富,多地图底图支持 - 💯 容易定制: 数据驱动,从数到形,支持多图层及多图表层叠 - 🌱 动态交互:图表交互能力强、支持 2/3D 视角、提供命令式动态交互 API ## 📦 安装 ```bash $ npm install @antv/l7plot ``` ## 🔨 使用
```html
``` ```ts import { Dot } from '@antv/l7plot'; const data = [ { lng: 103.715, lat: 31.211, depth: 10, mag: 5.8, title: 'M 5.8 - eastern Sichuan, China' }, { lng: 104.682, lat: 31.342, depth: 10, mag: 5.7, title: 'M 5.7 - eastern Sichuan, China' }, // ... ]; const dot = new Dot('container', { map: { type: 'mapbox', style: 'light', center: [103.447303, 31.753574], zoom: 7, }, autoFit: true, source: { data: data, parser: { type: 'json', x: 'lng', y: 'lat' }, }, color: { field: 'mag', value: ['#82cf9c', '#10b3b0', '#2033ab'], scale: { type: 'quantize' }, }, size: { field: 'mag', value: ({ mag }) => (mag - 4.3) * 10, }, state: { active: true }, scale: { position: 'bottomright' }, legend: { position: 'bottomleft' }, tooltip: { items: ['title', 'mag', 'depth'], }, }); ``` ## 本地开发 ```bash # 全局安装 yarn $ npm install yarn -g # 安装项目依赖 $ yarn bootstrap # 实时编译各 package 并启动 storybook $ yarn dev # 运行网站 $ yarn dev-website # 运行单元测试 $ yarn test # 打开 electron 运行单元测试,并监听测试文件 $ yarn test-live ``` ## 🤝 如何贡献 如果您在使用的过程中碰到问题,可以先通过 [issues](https://github.com/antvis/l7plot/issues) 看看有没有类似的 bug 或者建议。 如需提交代码,请遵从我们的[贡献指南](https://github.com/antvis/l7plot/blob/master/CONTRIBUTING.zh-CN.md)。 ## 许可证 MIT